BEGINNER LEVEL
Every price chart is a record of an argument. On one side are the buyers, convinced the price is about to go higher and willing to pay up to own the asset. On the other side are the sellers, convinced the opposite, and willing to let go of what they hold at the current price. Every tick on a chart is a snapshot of who won that argument in that instant. Technical analysis is the discipline of reading that ongoing argument, in detail, to make better decisions about when to buy, when to sell, and when to simply stay out of the way.
This article is the starting point for a series built around one goal: turning technical analysis from a vague buzzword into a practical, repeatable skill you can apply to real markets, whether you are looking at a stock, a currency pair, a cryptocurrency, or gold. We will use real, dated market data throughout this series rather than invented examples, starting with a genuine two-month stretch of Apple Inc. (AAPL) daily price data from July 22 to September 30, 2025, sourced from public market data records. Seeing how these concepts play out in an actual, verifiable price history makes them far more useful than studying a textbook diagram that conveniently shows a perfect pattern.
Technical analysis versus fundamental analysis
There are two broad schools of thought for deciding what to do in a market. Fundamental analysis asks: what is this asset actually worth? A fundamental analyst studying a company will pore over earnings reports, revenue growth, profit margins, competitive position, and macroeconomic conditions to estimate a fair Value, then compare that estimate to the current price. A fundamental analyst studying a currency pair will look at interest rate differentials, inflation, and trade balances. This approach is slow, research-heavy, and generally suited to longer holding periods.
Technical analysis asks a different question: what are other people trading this asset doing right now, and what are they likely to do next? Instead of researching the underlying business or fconomy, a technical analyst studies the price and volume data directly, looking for patterns in how supply and demand have behaved historically and how they are behaving right now. This is precisely wyy technical analysis is the dominant tool for speculation, meaning the pursuit of profit from price movement over days, weeks, or months rather than from decades of compounding ownership. It does not require you to become an expert in semiconductor supply chains or central bank policy. It requires you to become skilled at reading a chart, and that skill transfers across asset classes almost without modification.
The three ideas technical analysis is built on
Nearly everything in technical analysis traces back to three working assumptions. None of them are laws of physics, and serious traders understand that each one breaks down occasionally, but together they explain why studying a chart is a reasonable way to make decisions.
The first assumption is that price reflects all available information. Whatever is known, rumored, feared, or hoped about an asset, from a surprise product announcement to a shift in trader sentiment, eventually shows up in the price, often faster than an individual trader can read the news and react to it. This does not mean prices are always rational. It means that by the time most people have processed a piece of information, the price has frequently already moved, which is exactly why studying price action gives you a shortcut to the same information without needing to be first to read every headline.
The second assumption is that prices move in trends rather than bouncing around randomly. Once buyers gain control and push a price higher, that momentum tends to attract more buyers, who push it higher still, at least for a while. The same applies in reverse during a decline. This is why a huge portion of technical analysis is devoted to identifying the direction of the current trend and trading in harmony with it rather than against it.
The third assumption is that history tends to repeat itself, not because charts are magical, but because the humans (and increasingly, the algorithms trained on human behavior) trading any given market behave in recognizably similar ways across different decades and different assets. Fear causes panic selling. Greed causes chasing. Both leave visible fingerprints on a chart, fingerprints that recur often enough to be worth studying.
What a price chart is actually showing you
A price chart has two axes: time running left to right along the bottom, and price running bottom to top along the side. Every single point or bar on the chart summarizes what happened to the price during one slice of time, and that slice can be as short as one minute or as long as one month, depending on what you set the chart’s timeframe to.
The simplest way to draw a chart is a line connecting the closing price at the end of each time period. It is clean and easy to read but throws away most of the detail. A step up from that is an OHLC bar, short for open, high, low, and close, which uses a vertical line for the high-to-low range of the period with two small tick marks for the opening and closing prices. Today, the dominant format by far is the candlestick, which packs the same open, high, low, and close information into a small rectangle with thin lines, called wicks, extending above and below it. Candlesticks are popular because the human eye can scan a row of them and instantly judge who won each period, the buyers or the sellers, just from the color and shape of each candle. We will cover candlestick patterns in detail in a dedicated article later in this series; for now, the important thing is simply recognizing that almost every real chart you will encounter, including the one below, is built from candlesticks.
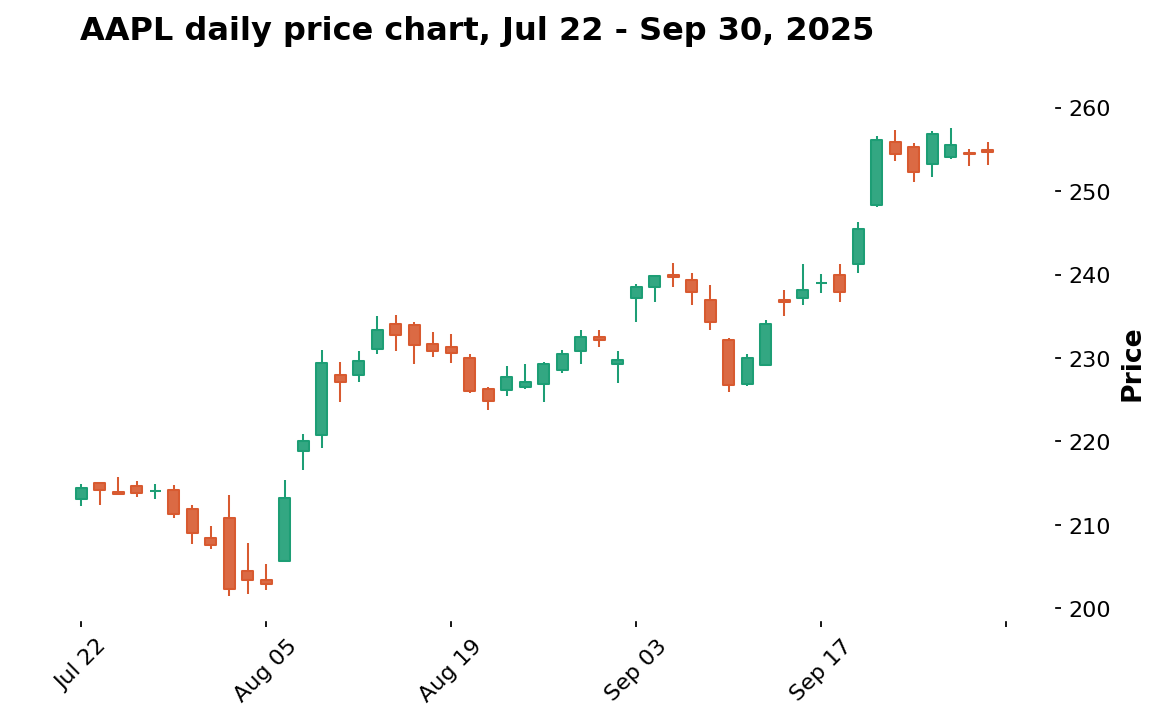
Data: TipRanks historical prices, Apple Inc. (AAPL), daily candles, Jul 22 – Sep 30, 2025.
This is a genuine, unedited price history, not a constructed example, and it is worth walking through slowly because every concept in this series will eventually refer back to it. At the left edge, AAPL spends the final days of July drifting slightly lower, closing around $207 to $214. In the first days of August the stock drops sharply, falling from roughly $211 to a low near $201.50, a decline of more than four percent in just a few sessions. Sharp single-session moves like this are typically triggered by earnings reports, guidance changes, or a sudden shift in broader market sentiment, and they are a normal, recurring feature of real markets rather than an anomaly.
What happens next is just as instructive. Rather than continuing to fall, the stock reverses hard: a roughly five percent gain on August 6, followed by a more than three percent gain the next day, and another four percent the day after that, carrying the price from about $202 back above $229 in under a week. The stock then spends nearly three weeks digesting that rally, drifting sideways in a band roughly between $224 and $233, before resuming the climb through September. A second, smaller pullback into September 10 takes the price back to around $226, and then a final, decisive breakout on September 19 and September 22, gaining over three percent and then over four percent on consecutive sessions, pushes AAPL to a fresh high near $256 by the end of the period.
Notice what this real two-month window already contains: a decline, a sharp reversal, a sideways consolidation, a smaller pullback, and a breakout to new highs. Every one of those phases has a name and a body of technique attached to it in technical analysis, and we will revisit this exact stretch of AAPL data again and again throughout this series to demonstrate support and resistance, trend identification, moving averages, momentum readings, chart patterns, risk management, and even a simple backtest, all using one consistent, verifiable, real-world example instead of a different invented chart for every lesson.
What technical analysis can do, and what it cannot
It is worth being honest about the limits of this discipline before going any further, because misunderstanding what technical analysis promises is one of the fastest ways to lose money. Technical analysis cannot tell you what an asset is intrinsically worth. It cannot predict the future with certainty, and no indicator, pattern, or strategy wins on every single trade; professional traders routinely operate with win rates well under 50 percent and still make money, because they manage the size of their losses relative to their wins. Technical analysis also cannot protect you from genuine surprises, such as a sudden geopolitical event or an unexpected regulatory announcement, that move a price violently with no prior warning visible on any chart.
What technical analysis can do is give you a structured, repeatable process for deciding when an opportunity is favorable enough to act on, where exactly you would be wrong if the trade does not work out, and how to size a position so that being wrong does not seriously damage your capital. That structure, more than any single pattern or indicator, is what separates a speculator with a process from someone who is simply gambling on coin flips with extra steps.
One skill, many markets
The reason this series treats technical analysis as a single core skill, rather than teaching a different system for stocks, forex, crypto, and gold, is that the underlying tools genuinely transfer. A support level, a trendline, a moving average, and a candlestick pattern mean essentially the same thing whether you are looking at a technology stock, a currency pair, or a cryptocurrency, because in every case you are studying the same underlying force: the balance between buyers and sellers expressed through price. Later articles in this series will dig into the genuine personality differences between markets, such as the influence of macroeconomic data on currencies, the 24-hour nature of crypto, or the role of the US dollar in gold pricing, but the foundation you are building right now, starting with this article, will not need to be relearned from scratch when you move between them.
Getting started without losing money while you learn
- Open a demo or paper trading account before risking real capital. Nearly every broker and exchange offers one, and it lets you practice reading charts and placing trades with consequence-free feedback.
- Pick one or two markets to focus on while you learn rather than trying to watch stocks, forex, crypto, and gold simultaneously. Depth beats breadth early on.
- Learn to read a plain price chart, with no indicators at all, before adding tools on top of it. If you cannot describe what a chart is doing in your own words, an indicator will not save you.
- Start a trading journal on day one, even during paper trading. Write down what you saw, what you expected, and what actually happened. This single habit accelerates learning more than any single book or course.
- Expect to spend real time, typically weeks to several months, building comfort and consistency before committing meaningful capital. Technical analysis rewards patience in the learning phase even though it is often used to time short-term decisions once mastered.
Key takeaways
- Technical analysis studies price and volume directly to gauge what other market participants are likely to do next, rather than estimating an asset’s fundamental value.
- It rests on three working assumptions: price reflects available information, prices move in trends, and historical patterns tend to recur because trader psychology recurs.
- Modern charts are built from candlesticks, which compactly display the open, high, low, and close for each time period.
- The real AAPL example covered here, a decline, sharp reversal, consolidation, and breakout between July and September 2025, will reappear throughout this series as a consistent, verifiable case study.
- Technical analysis provides a structured process for managing risk and timing decisions; it does not provide certainty, and no approach wins every time.
Disclaimer
This article is for aducational purposes only and does not constitute financial or investment advice. Technical analysis identifies probabilities, not certainties, and past price behavior is not a guarantee of future results. The AAPL example used here illustrates a real historical price move and is not a recommendation to buy or sell any security. Always do your own research and consider consulting a licensed financial advisor before trading or investing.
Leave a Reply