
BEGINNER LEVEL
Understanding Trends: Bullish vs. Bearish Markets
There is an old piece of trading wisdom that gets repeated so often it risks sounding empty: the trend is your friend. It survives because it is true, and because so many beginning traders lose money doing the opposite, fighting a clear trend because a price feels too high to buy or too low to sell. Before you can trade with the trend, though, you need a precise, repeatable way to identify what the trend actually is, rather than relying on a gut feeling about whether a chart looks like it is going up or down.
For this article we use the SPDR S&P 500 ETF, ticker SPY, the exchange-traded fund that tracks the S&P 500 index of 500 large US companies. Like the Nasdaq 100 ETF used elsewhere in this series, it is an index fund rather than a single stock, which makes it an ideal teaching example: its movements reflect the broad market rather than the fortunes of one company, and the data shown here is genuine daily price history from April to May 2026, sourced from public market records.
Defining an uptrend and a downtrend precisely
The standard technical definition of an uptrend is a sequence of higher highs and higher lows. Each time the price pulls back from a peak, it does not fall all the way back to the previous low; it finds support at a higher point than before, then pushes on to a new peak above the last one. A downtrend is the exact mirror image: a sequence of lower highs and lower lows, where each rally fails below the previous peak before price pushes down to a new low.
This definition matters because it is objective. You do not need to guess whether a chart looks bullish; you can check, point by point, whether each swing low sits above the prior swing low. When that condition stops being true, for example when a new low forms below the previous low during what had been an uptrend, that is meaningful evidence the trend may be changing, not just noise to ignore.
A real uptrend, traced step by step
The chart below shows a genuine uptrend in SPY across April and May 2026. The rising trendline on it is not drawn by eye: it is fitted mathematically through the chart's actual detected swing lows, the green triangles, so it runs along the genuine floor of the price action rather than being placed wherever looked convenient. This is the honest version of the technique this article teaches.
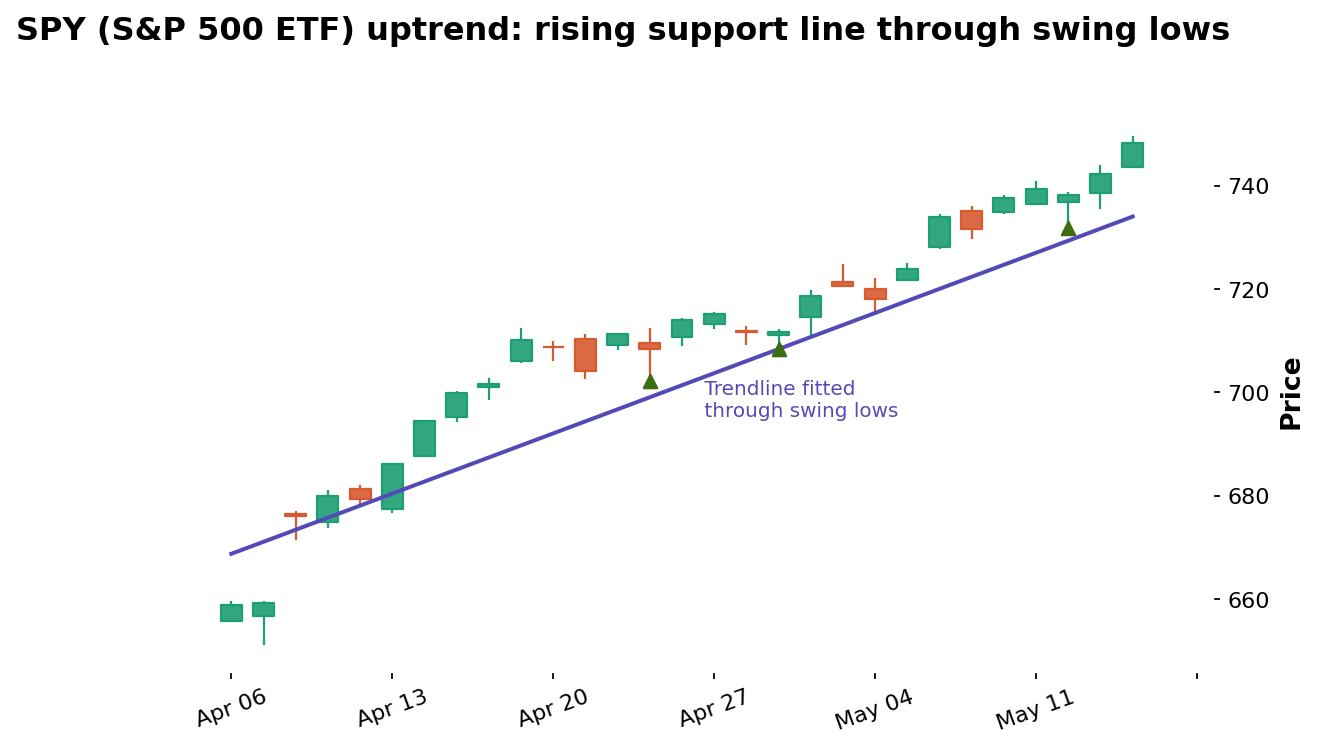
Data: stockanalysis.com (Tiingo), SPY daily candles, Apr 6 – May 14, 2026. Trendline fitted through algorithmically detected swing lows.
Trace the real swing lows the trendline connects: a low of $702.28 on April 23, then a higher low of $708.37 on April 29, then a higher low again of $731.83 on May 12. Each pullback found a floor above the previous floor, the textbook definition of an uptrend, not a perfectly straight line but a staircase climbing from roughly $659 in early April toward $748 by mid-May. The fitted trendline connecting those ascending lows gives you a visual, moving reference for where the next pullback might find support if the uptrend remains intact, and a clear, objective signal if price closes decisively below it instead.
A trendline like this is simply a straight line touching at least two swing lows. The crucial discipline, and the thing that was wrong with poorly drawn trendlines, is that it must actually touch the real lows and otherwise sit below the price, acting as a floor. A line that cuts straight through the middle of candle bodies is not a trendline; it is a mistake, because it no longer represents a level where price actually found support.
Why trading with the trend is statistically easier
An established trend, by definition, means the larger force in the market, the side with the upper hand, is already clearly identifiable. Betting that an established uptrend will continue means aligning yourself with that larger force rather than betting it will suddenly reverse with no specific evidence yet that it is doing so. This does not make trend-following trades risk-free; trends do end, sometimes abruptly. It does mean the odds, averaged across many trades, tend to favor positions taken in the direction of a clear, established trend over positions taken against it without a specific, well-defined reason.
Sideways markets: the third state
Not every chart is trending. A large amount of time in any market is spent in a sideways or range-bound state, where price oscillates between a fairly consistent support zone and resistance zone without making a sustained sequence of higher highs and higher lows, or lower highs and lower lows. Recognizing a sideways market matters because trend-following techniques tend to perform poorly inside one, generating false signals as price chops back and forth. A different set of tools, generally built around support and resistance rather than trend, tends to work better here, which is exactly why the previous article in this series covered those concepts first.
A trendline break is a warning, not automatically a reversal
One of the most important distinctions in trend analysis is that a trendline break and a trend reversal are not the same event, even though beginners frequently treat them as interchangeable. A trendline break simply means price has closed on the wrong side of the specific line you drew connecting recent swing lows; it is genuine evidence that the immediate pace of the trend has changed, but it does not, by itself, prove that the broader sequence of higher highs and higher lows has actually reversed into lower highs and lower lows. A confirmed reversal requires the stricter condition: an actual lower low forming after a lower high, undoing the trend's defining structure, not merely a dip below a single trendline drawn at a particular angle. Many genuine, healthy uptrends break their initial, steep trendline at least once without reversing, simply settling into a gentler, more sustainable angle afterward, which is why a trendline break should prompt closer attention and tighter risk management rather than an automatic decision to reverse your entire view.
Trendline angle and why steep trends are fragile
The angle of the trendline is a useful clue about how durable a trend is. A gentle, gradually rising trendline tends to reflect a healthy balance between buying interest and normal profit-taking, and these trends often persist for a long time precisely because they are not moving fast enough to attract the kind of frantic, emotional buying that exhausts itself quickly. A very steep trendline, where price is rising sharply over a short number of sessions, often reflects exactly that kind of emotional buying, covered in more detail in the trading psychology article later in this series, and these steep moves frequently end in a sharp reversal rather than a graceful slowdown. The SPY trendline in this article has a moderate, sustainable slope; had the same total gain happened in one week instead of several, the steeper line would have represented a far more fragile, higher-risk trend to enter late.
Confirming trend strength with candle behavior
Beyond the basic higher-highs-and-higher-lows definition, you can read additional information from the shape of the candles themselves. A healthy uptrend typically shows candles with solid bodies and relatively short wicks on the pullbacks, indicating sellers are not gaining much control even during the temporary dips. A weakening uptrend often shows pullback candles with long upper wicks and small bodies, indicating buyers are pushing price up intraday but losing control by the close, a subtle warning sign worth watching even while the higher-low structure technically remains intact. Where volume data is available, a genuinely healthy trend is generally confirmed by higher volume on the advancing legs than on the pullback legs, showing conviction is concentrated with the side currently in control.
Multiple timeframes can show different trends at once
One detail that confuses many beginners: it is entirely possible, and actually common, for the same asset to be in an uptrend on a daily chart while simultaneously chopping sideways or even trending down on a much shorter, hourly chart. Neither view is wrong; they are simply describing different time horizons. A later article in this series, on multi-timeframe analysis, deals with this directly and shows how experienced traders reconcile the two rather than picking one timeframe and ignoring the rest.
Trend behavior across different markets
The basic mechanics of a trend apply identically whether you are looking at an index ETF like SPY, a forex pair, a cryptocurrency, or gold, but the typical duration and smoothness varies by market. Major forex pairs, driven heavily by slow-moving macroeconomic forces like central bank policy, often sustain gentle trends for many months. Cryptocurrency markets, trading continuously with a large retail base and thinner liquidity, tend to produce steeper, more emotional trends that reverse more abruptly. Gold often trends slowly but can develop strong, extended directional moves during periods of macroeconomic uncertainty, when its perceived safe-haven role draws sustained buying or selling. A broad index ETF like SPY generally sits at the smoother, steadier end of this spectrum, which is part of why it makes such a clear teaching example for trend structure.
Practical checklist for judging a trend
Identify the most recent two or three swing highs and swing lows on your chosen timeframe before forming an opinion about direction.
Confirm that each new swing low sits above the previous swing low for an uptrend, or each new swing high sits below the previous swing high for a downtrend.
Draw a trendline that actually touches at least two swing lows and otherwise sits below price; if your line cuts through candle bodies, it is wrong and needs redrawing.
If you cannot identify a clear sequence of higher highs and higher lows, or lower highs and lower lows, default to assuming the market is range-bound rather than forcing a trend label onto it.
Treat a trendline break as a warning that demands attention and tighter risk management, not as automatic proof the trend has reversed; wait for an actual lower low to confirm a true reversal.
It is also worth remembering that a trend can pause for an extended period, the sideways consolidation described earlier, without ever technically violating its higher-low structure, since a pause simply means no new swing low has formed yet rather than a lower one. Patience through these pauses, supported by the position sizing and risk management techniques covered elsewhere in this series, is frequently what separates traders who capture the full length of a strong trend from those who exit early at the first sign of consolidation.
None of this requires predicting anything in advance. It only requires correctly reading a structure the chart has already begun to reveal, which is exactly what makes trend identification one of the more teachable, repeatable skills in this entire series.
Key takeaways
An uptrend is a sequence of higher highs and higher lows; a downtrend is a sequence of lower highs and lower lows.
The real SPY data from Apr to May 2026 shows a genuine uptrend, with successive swing lows at $702.28, $708.37, and $731.83, each higher than the last.
The trendline on the chart was fitted mathematically through those real detected swing lows, so it runs along the genuine floor of the price action rather than cutting through candles.
A trendline break is a warning that warrants attention and tighter risk management, not automatic proof of a reversal; a true reversal requires an actual lower low after a lower high.
Markets spend significant time range-bound rather than trending, and a broad index ETF like SPY tends to produce smoother, steadier trends than a thinly traded individual asset or a volatile cryptocurrency.
Disclaimer
This article is for educational purposes only and does not constitute financial or investment advice. Trend identification is based on historical price behavior and does not guarantee future direction. The SPY example used here is real historical data shown for illustration and is not a recommendation to buy or sell any security. Always do your own research and consider consulting a licensed financial advisor before trading or investing.