
BEGINNER LEVEL
TA on Gold: Trading the Safe Haven
Gold has been a store of value for thousands of years, long before stocks, currencies, or cryptocurrencies existed, and it occupies a unique place in the financial world. For a technical analyst who has worked through the Foundation articles in this series, gold is approachable in exactly the same way as any other market: the candlesticks, trends, support and resistance, and risk management you already know all apply directly to a gold chart. What makes gold distinctive is not how its chart is read, but what drives it, the particular forces of fear, the US dollar, and interest rates that move the metal, and the special role it plays as a so-called safe haven. This beginner article introduces gold as a tradeable market and explains the forces that give it its character.
Throughout this article we use real, verifiable data from the SPDR Gold Shares ETF, ticker GLD, the largest gold exchange-traded fund, which holds physical gold and tracks its price closely, providing a clean, auditable proxy for the price of gold itself. The data covers April to June 2026 and comes from public market records.
What gold is as a tradeable asset
Unlike a stock, gold is a commodity, a physical raw material, and it represents no company, pays no dividend, and generates no earnings. Its value comes purely from what others are willing to pay for it, driven by its long history as a store of wealth, its use in jewelry and industry, and its role as a hedge against uncertainty. This means that the fundamental analysis used for stocks, studying earnings and revenue, simply does not apply to gold; there are no financial statements to read. This is part of why technical analysis, the study of price action itself, is so widely used for gold: with no earnings to anchor a valuation, price behavior and the forces of supply and demand become the primary things a trader can study.
Gold can be traded in several forms, including physical bullion, futures contracts, the shares of gold mining companies, and gold ETFs like the one used in this article. For most traders applying technical analysis, an ETF or futures contract is the practical vehicle, since both track the gold price closely and trade on regular exchanges with clean, liquid charts.
The safe-haven reputation
Gold's most famous characteristic is its reputation as a safe haven, an asset that investors flock to during times of fear, uncertainty, or crisis. The reasoning is that when stocks are falling, economies are wobbling, or geopolitical tensions are rising, gold's millennia-long history as a store of value makes it feel safer than assets tied to any particular company or government. This creates a tendency, though only a tendency, for gold to rise when fear grips other markets.
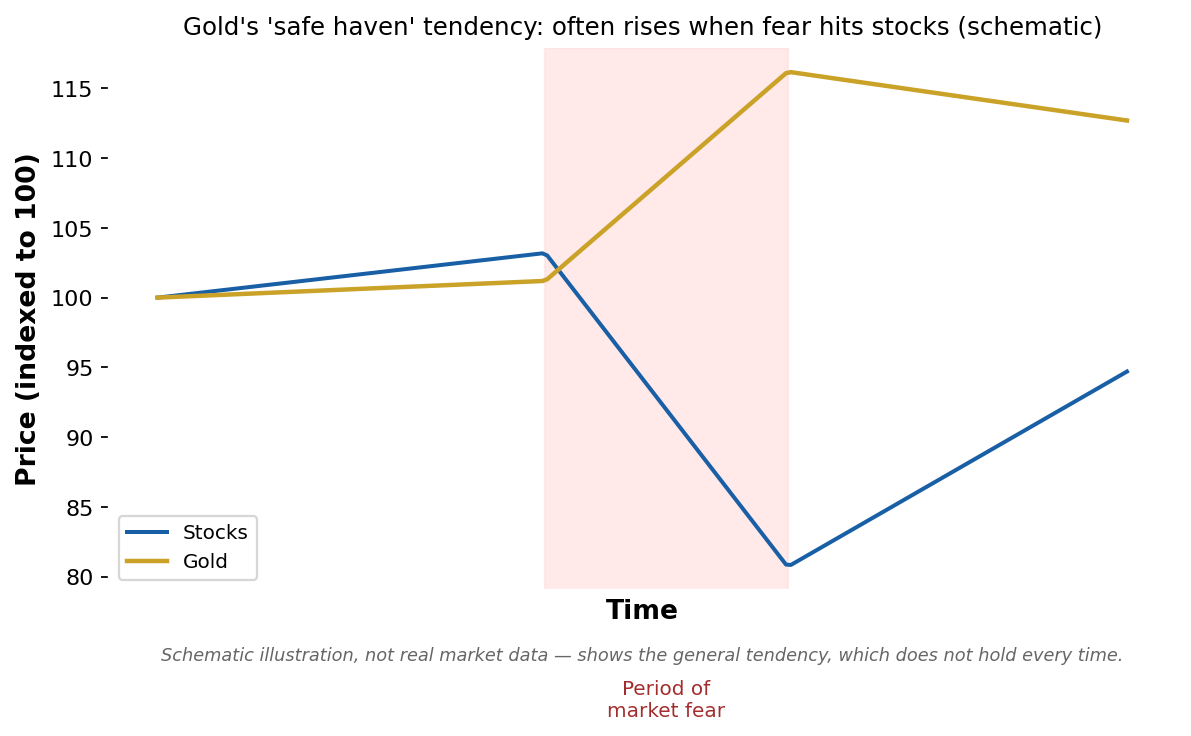
Schematic illustration of gold's safe-haven tendency, not real market data; the pattern is a general tendency that does not hold every time.
The schematic above illustrates the idea: during a period of market fear, when stocks fall sharply, gold often rises as capital seeks safety, sometimes making it one of the few assets to gain when a portfolio of stocks is losing. This is why many investors hold some gold as a form of insurance, a position expected to perform well precisely when the rest of their holdings struggle. For a trader, this tendency matters because it means gold often responds to the broad emotional climate of the markets, rising on fear and sometimes drifting when confidence returns, a different driver from the company-specific or sector forces that move individual stocks.
It is essential to understand, however, that the safe-haven relationship is a tendency, not a law. Gold does not rise during every market decline, and it can fall sharply on its own, as the real data later in this article shows. Treating the safe-haven reputation as a guarantee, rather than a general tendency that holds more often than not, is a mistake that the disciplined risk management from the Foundation series exists to protect against.
A real gold chart
Here is genuine GLD data, which illustrates both that gold trades with familiar technical structure and that it is fully capable of significant declines despite its safe-haven reputation.
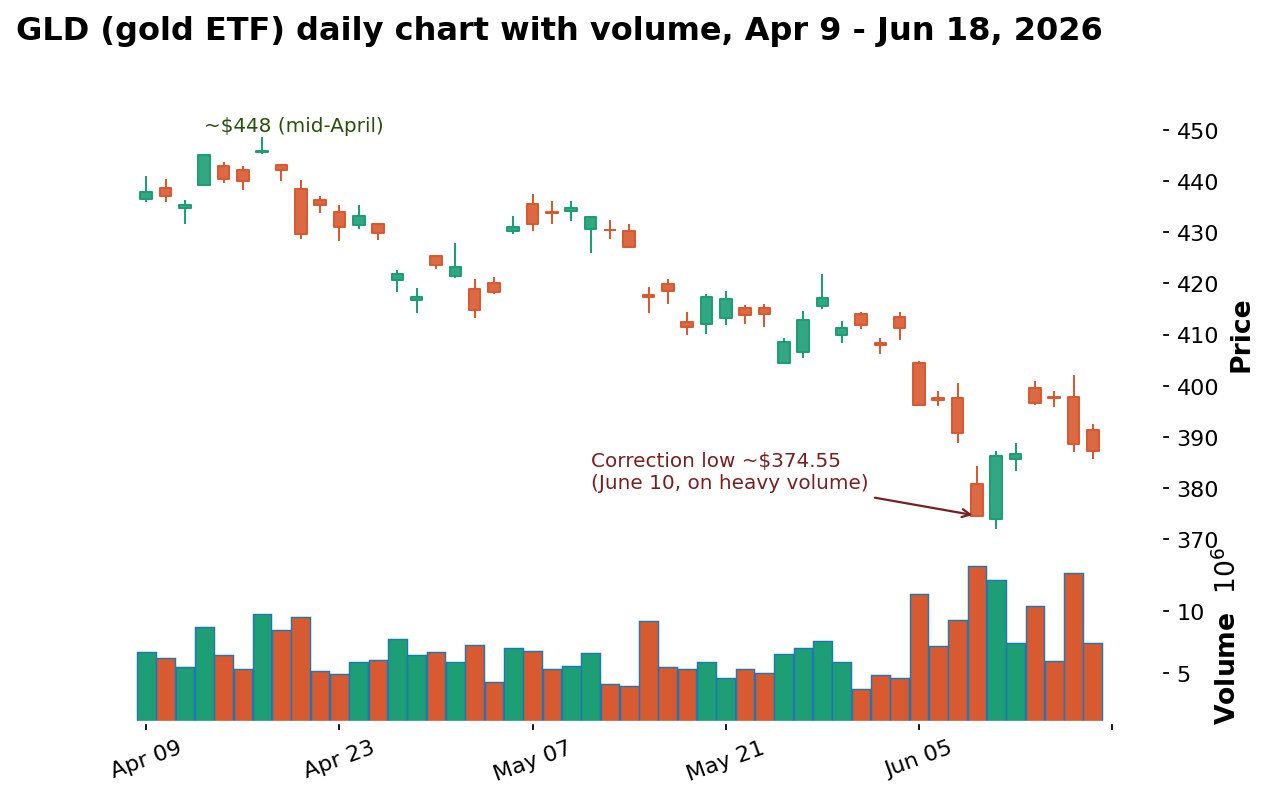
Data: stockanalysis.com (S&P Global), SPDR Gold Shares (GLD), daily candles with volume, Apr 9 – Jun 18, 2026.
This real chart shows gold in a correction. After trading near $448 in mid-April, GLD declined over the following weeks, with the selling accelerating into early June and reaching a low near $374.55 on June 10, on the heaviest volume of the period, visible in the volume bars beneath the price, before rebounding somewhat. That is a decline of roughly 16 percent from the April high to the June low, a substantial move that, according to contemporaneous financial news, was driven largely by a strengthening US dollar and expectations of higher interest rates, forces this track explores in its later articles. The key beginner lesson here is twofold. First, gold trends, finds support and resistance, and forms the same technical structures as any other market, so the Foundation skills apply directly. Second, gold's safe-haven reputation does not make it immune to sharp declines; it is a real, volatile market that must be traded with the same disciplined risk management as anything else.
What moves the price of gold
While this series focuses on technical analysis, a gold trader benefits from understanding in broad terms what drives the metal, since these forces shape the supply and demand that price reflects. Three forces stand out. The first is fear and uncertainty, the safe-haven demand already described, which tends to lift gold during crises. The second is the US dollar: because gold is priced in dollars globally, a stronger dollar tends to push the gold price down and a weaker dollar tends to lift it, an inverse relationship the intermediate article in this track examines in detail and which helps explain the real decline shown above. The third is interest rates: because gold pays no interest itself, it becomes relatively less attractive when interest rates rise and safe, interest-paying assets like bonds offer a better return, and relatively more attractive when rates fall. The interplay of these forces, explored more deeply later in this track, is what gives gold its distinctive behavior.
Why gold suits technical analysis well
Gold is, in several respects, an excellent market for applying technical analysis. It is highly liquid, meaning it trades in large volume with tight spreads, which produces clean, reliable charts. It tends to form clear, sustained trends, since the macro forces that drive it, dollar strength and interest rate trends, shift gradually, much like the forces behind major currency pairs in the forex track. And it respects support and resistance levels well, partly because it is so widely watched that key levels become self-reinforcing focal points, exactly the dynamic described in the Foundation support and resistance article. These qualities make gold a popular market for trend-following and level-based strategies, and a natural place to apply the skills built throughout this series.
The different ways to trade gold
Because gold is such an old and widely held asset, there are more ways to gain exposure to it than to most markets, and understanding the options helps a beginner choose the right vehicle. Physical gold, coins and bars, is the most direct form of ownership, but it carries storage and insurance costs and is impractical for active trading, since buying and selling physical metal involves dealers, premiums, and delays. Gold futures contracts, traded on commodity exchanges, are the primary vehicle for professional speculators and large institutions; they track the gold price closely and offer deep liquidity, but they involve leverage, expiration dates, and contract specifications that make them more complex for a beginner. Gold ETFs, like the one used throughout this article, hold physical gold or futures on behalf of shareholders and trade like an ordinary stock, which makes them the simplest and most accessible vehicle for most traders applying technical analysis, since they require no special account and produce clean, liquid charts. Finally, the shares of gold mining companies offer leveraged exposure to the gold price, since a miner's profits rise and fall faster than the metal itself, but they also carry company-specific risks, management decisions, production costs, and the broader stock market's influence, that pure gold exposure does not, which means a miner's chart reflects more than just the gold price.
For a beginner learning to apply technical analysis to gold, a major gold ETF is usually the most sensible starting point. It behaves like the gold price itself, trades during normal market hours on a regular exchange, requires no specialized futures account, and produces exactly the clean candlestick charts that the techniques in this series are built around. Once comfortable, a trader can consider futures for their leverage and capital efficiency or mining shares for their amplified exposure, but the ETF removes unnecessary complexity while the core chart-reading skills are still being built.
Gold's relationship with the broader portfolio
One reason gold is so widely followed, even by traders who never buy it, is its historical tendency to behave differently from stocks and bonds, which gives it value as a portfolio diversifier quite apart from its appeal as a trade. Because gold often performs well precisely when other assets struggle, particularly during inflationary periods or crises of confidence, it has historically served as a counterweight that can smooth the overall ups and downs of a diversified portfolio. For a technical trader, this matters in two ways. First, it explains part of the persistent, structural demand for gold, since large institutions hold it for diversification regardless of short-term price action, which contributes to its liquidity and the reliability of its charts. Second, it reinforces why gold often moves on the broad emotional climate of markets rather than on company-specific news, since much of the buying and selling reflects portfolio-level decisions about risk and safety rather than any view specific to gold itself. Understanding this backdrop helps a beginner appreciate why gold trends the way it does and why the macro forces explored in the rest of this track matter so much.
Practical guidelines for trading gold
Apply the same technical toolkit you would to any market, trends, support and resistance, moving averages, and risk management, since gold's chart is read exactly like any other.
Treat gold's safe-haven reputation as a tendency, not a guarantee; gold can and does fall sharply on its own, as the real 16 percent correction shown here demonstrates.
Be aware of the US dollar's direction, since a stronger dollar generally pressures gold and a weaker dollar generally supports it.
Keep an eye on the interest rate environment, since rising rates tend to weigh on gold while falling rates tend to support it.
Use a liquid vehicle such as a major gold ETF or futures contract for clean charts, and apply disciplined position sizing and stops just as you would in any other market.
The reassuring conclusion, exactly as in the crypto, stocks, and forex tracks, is that gold does not require a separate technical method. The trends, levels, and risk management from the Foundation series transfer directly. What you are learning here is gold's particular character, its safe-haven role and its sensitivity to the dollar and interest rates, so you can apply your existing skills with the right context. The intermediate and expert articles in this track build on this foundation, examining gold's relationship with the dollar in detail and then the deeper macro drivers, seasonal patterns, and positioning data that sophisticated gold speculators study.
Key takeaways
Gold is a commodity with no earnings, so technical analysis, the study of price itself, is especially central to trading it.
Gold's safe-haven reputation means it often rises during market fear, but this is a tendency, not a guarantee, and gold can fall sharply on its own.
The real GLD data from Apr to Jun 2026 shows a correction of roughly 16 percent from the April high near $448 to the June low near $374.55, driven largely by a strong dollar and rising rate expectations.
Gold is moved primarily by fear and uncertainty, the US dollar's strength, and interest rates, all of which shape the supply and demand that price reflects.
Gold's liquidity, tendency to trend, and respect for key levels make it an excellent market for the technical techniques built throughout this series.
Disclaimer
This article is for educational purposes only and does not constitute financial or investment advice. The GLD example used here is real historical data shown for illustration and is not a recommendation to buy or sell any security or commodity. The safe-haven diagram is a schematic illustration. Always do your own research and consider consulting a licensed financial advisor before trading or investing.