
EXPERT LEVEL
Seasonal Cycles and COT Data: Advanced Gold Speculation
The beginner and intermediate articles in this gold track established gold as a tradeable market and explored its defining relationship with the US dollar. This expert article goes beneath the price to the deeper forces and specialized data sources that sophisticated gold speculators study: the inflation-adjusted real interest rates that are arguably gold's single most important long-term driver, the Commitments of Traders report that reveals how different groups of traders are positioned, and the seasonal patterns that some traders incorporate into their analysis. These are advanced tools that layer on top of, rather than replace, the disciplined technical analysis and risk management built throughout this series. As elsewhere in this track, the real price data comes from the verified SPDR Gold Shares (GLD), April to June 2026.
Real interest rates: gold's deepest driver
The intermediate article noted that interest rates influence gold, since the metal pays no interest of its own. At the expert level, this idea must be refined into one of the most important concepts in all of gold analysis: the distinction between nominal and real interest rates. The nominal interest rate is the headline rate set by a central bank or paid by a bond. The real interest rate is that nominal rate minus inflation, and it represents the true, inflation-adjusted return on holding an interest-bearing asset. This distinction matters enormously for gold because gold's opportunity cost, what you give up by holding non-yielding gold instead of an interest-bearing asset, depends on the real rate, not the nominal one.
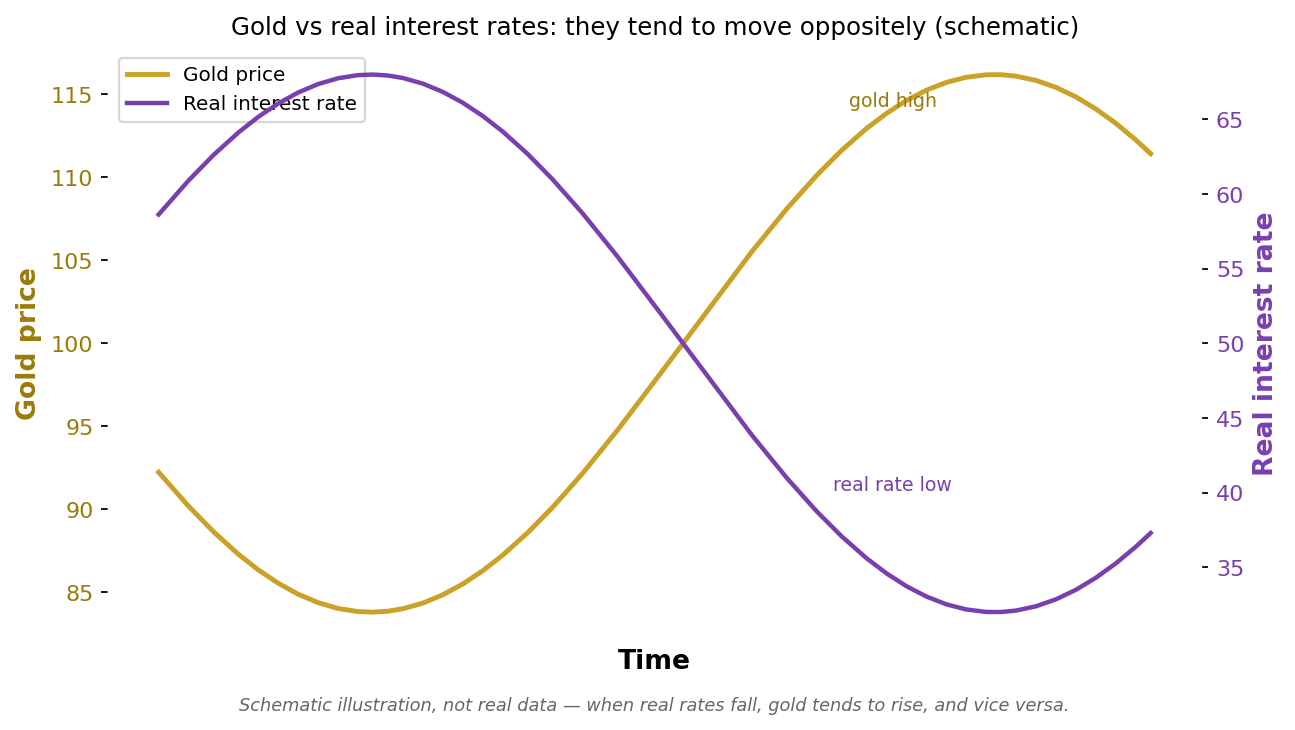
Schematic illustration of gold's inverse relationship with real interest rates, not real market data; values chosen to show the concept.
The schematic above illustrates the core relationship: gold and real interest rates tend to move in opposite directions. When real rates fall, the opportunity cost of holding gold declines, since interest-bearing alternatives are offering little or no inflation-adjusted return, and gold becomes relatively more attractive, tending to rise. When real rates climb, interest-bearing assets offer a genuinely better inflation-adjusted return, raising the opportunity cost of holding non-yielding gold, and gold tends to fall. This is why real rates, more than nominal rates, are often described as gold's deepest fundamental driver. A striking implication is that gold can perform well even when nominal interest rates are high, provided inflation is even higher, because that combination produces low or negative real rates. Conversely, gold can struggle even when nominal rates seem moderate, if inflation is low enough that real rates are meaningfully positive.
The real GLD decline used throughout this track is illuminated by this lens. The metal fell sharply through late May and into June as, according to contemporaneous financial news, expectations grew that the central bank would keep interest rates higher for longer while inflation pressures were easing, a combination that pushes real interest rates upward. Rising real rates increase the opportunity cost of holding gold, which provides a deep, fundamental explanation for the persistent selling pressure visible on the chart, beyond the dollar strength discussed in the intermediate article. Indeed, the dollar strength and the rising real rates were two expressions of the same underlying shift toward tighter monetary expectations, which is why they pushed gold down in concert. An expert who reads gold through the real-rate lens sees the macro engine beneath both the dollar move and the price decline.
Why real rates unify the gold story
The power of the real-rate framework is that it unifies the seemingly separate drivers introduced earlier in this track. Safe-haven demand, the dollar relationship, and interest rates can all be understood as connected through the real-rate channel. During a crisis, central banks often cut rates and inflation expectations can shift, driving real rates down and supporting gold at the same moment that fear drives safe-haven demand. A strengthening dollar frequently accompanies rising real rates, since both respond to tighter monetary policy, which is why gold's inverse relationships with the dollar and with real rates so often appear together. Rather than memorizing three separate rules, an expert can hold a single organizing idea: gold tends to do well when the real, inflation-adjusted return on holding safe interest-bearing assets is low or falling, and tends to struggle when that real return is high or rising. This single principle explains a remarkable amount of gold's long-term behavior and gives the price chart a coherent macro foundation.
The Commitments of Traders report
A second advanced tool, entirely specific to futures-traded markets like gold, is the Commitments of Traders report, universally abbreviated COT. Published weekly by a US regulator, the COT report breaks down the open positions in gold futures by category of trader, revealing how different groups are positioned, information that has no equivalent in the simple price and volume data covered earlier in this series. It is, in effect, a window into who is holding what, updated every week.
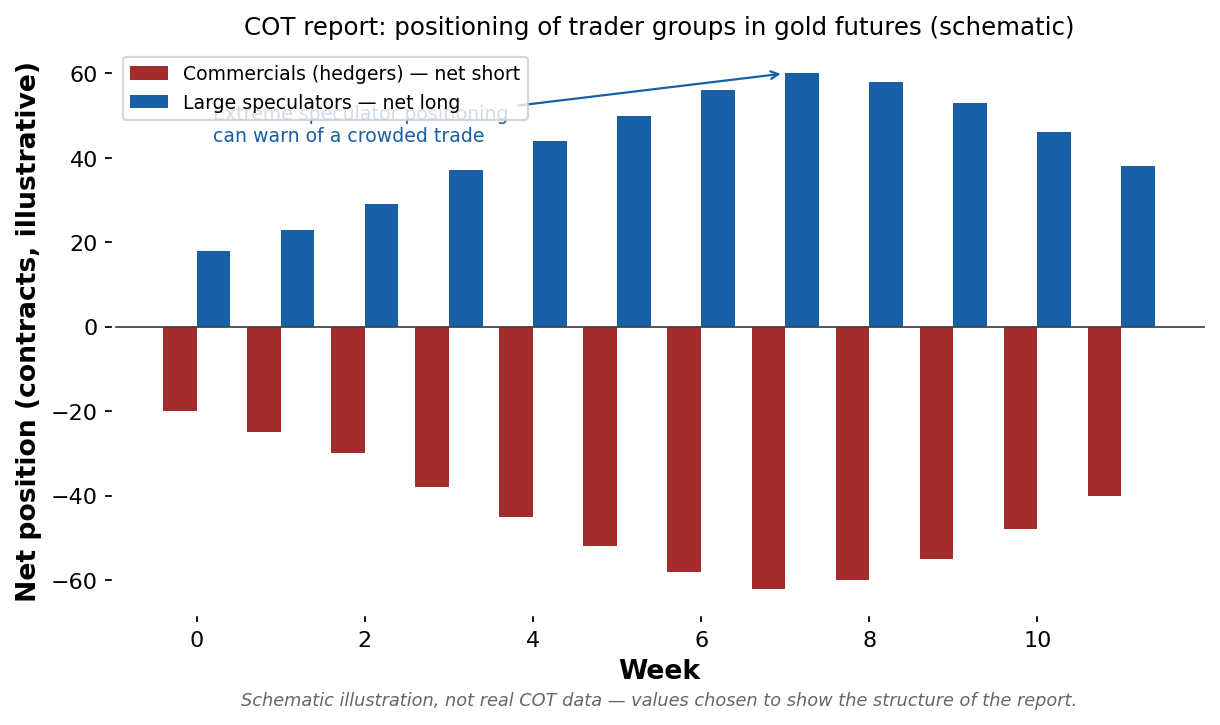
Schematic illustration of the structure of a COT report for gold futures, not real data; values chosen to show how the trader groups are organized.
The schematic above illustrates the structure. The report divides traders into broad groups, of which two are most watched. Commercial traders, often called hedgers, are typically producers and large users of gold who trade futures to hedge their real-world exposure rather than to speculate; they are frequently net short, as the red bars suggest, because producers sell futures to lock in prices. Large speculators, often trend-following funds, take the other side and are frequently net long during an uptrend, as the blue bars suggest. The analytical value of the COT report comes from watching the extremes of speculator positioning. When large speculators become extremely net long, it can indicate that a bullish trade has become crowded, with most of the available buyers already committed, which historically has sometimes preceded reversals, since there are few buyers left to push the price higher and a great many positions that could be unwound if sentiment turns. The reverse, extreme net-short speculator positioning, can sometimes precede bottoms.
It is essential to treat the COT report with care and humility. It is not a precise timing tool; positioning can remain at an extreme for a long time before any reversal occurs, and crowded trades can become more crowded before they unwind. The report is also published with a delay, reflecting positioning from earlier in the week, so it is a lagging indicator of sentiment rather than a real-time signal. The expert use of COT data is as a contextual, confirming input, a gauge of how stretched sentiment and positioning have become, layered alongside the price-based technical analysis and the real-rate macro picture, rather than as a standalone trigger for trades. A gold trade where the price chart, the real-rate backdrop, and the COT positioning all align is a higher-conviction setup than one supported by price alone; COT data is most valuable precisely as one more independent witness in the confluence approach this series has emphasized throughout.
Seasonality in gold
A third advanced consideration is seasonality, the tendency for an asset to exhibit recurring patterns at certain times of the year. Gold is one of the markets where seasonal analysis is most commonly discussed, because gold demand has genuine seasonal components rooted in the real world.
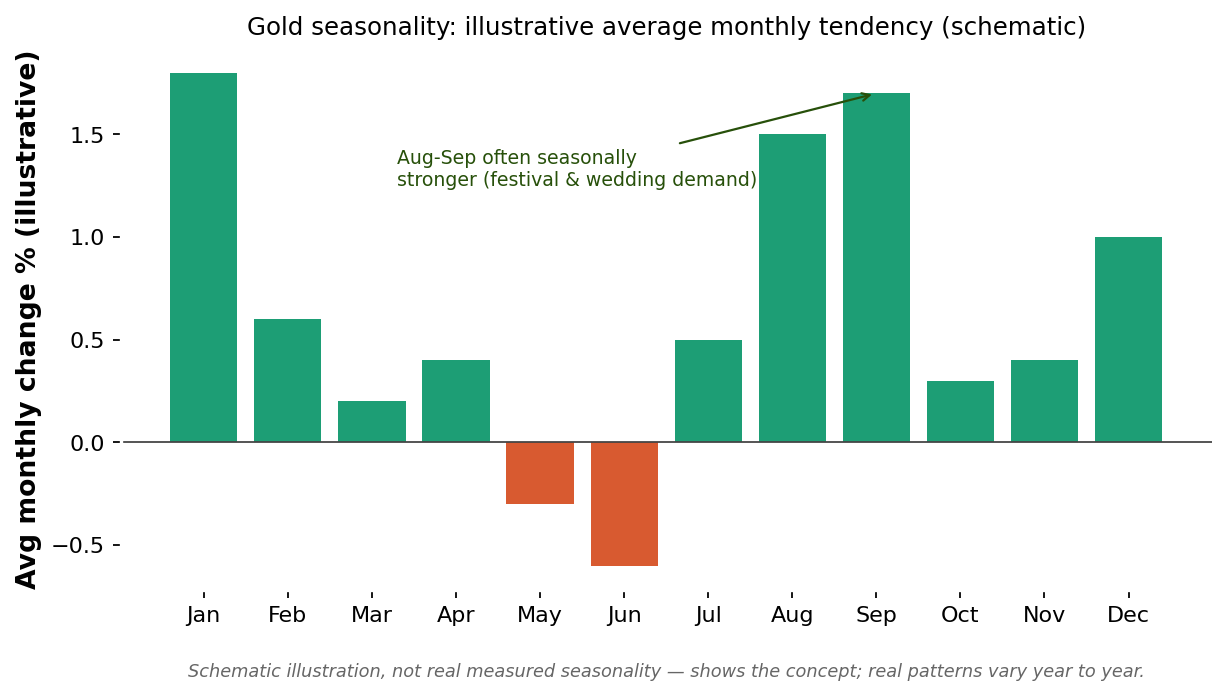
Schematic illustration of gold's seasonal tendencies, not real measured data; the pattern shown is illustrative and real seasonality varies considerably year to year.
The schematic above illustrates the concept of a seasonal pattern, with certain months tending, on average over many years, to be stronger or weaker than others. Gold's seasonality is often linked to physical demand cycles: for example, demand associated with certain festival and wedding seasons in major gold-consuming countries, and demand from jewelers building inventory ahead of those periods, has historically contributed to seasonal strength in parts of the year, while other stretches have tended to be weaker. Some traders use these tendencies as a gentle background consideration, a slight tilt in the odds, when planning trades.
The critical expert caveat is that seasonality is a weak, probabilistic tendency averaged over many years, not a reliable pattern that holds in any given year. In any single year, the dominant macro forces, the dollar, real interest rates, and major events, easily overwhelm the gentle seasonal tilt, and the real GLD data in this track is a perfect example: the metal declined sharply through a period regardless of any seasonal tendency, because the powerful macro forces of a strengthening dollar and rising real-rate expectations dominated completely. A trader who had bought gold purely because of a seasonal pattern, ignoring the overwhelming macro headwinds, would have been badly hurt. Seasonality, therefore, is at most a minor, supporting consideration that should never override the price chart, the macro picture, or risk management. It is the gentlest of the inputs discussed in this article, useful only as a faint tiebreaker when stronger signals are balanced, and dangerous if mistaken for a dependable rule.
Central bank gold buying: a structural force
Beyond the real-rate, positioning, and seasonal factors, an expert gold analyst pays attention to a slower, more structural force that has grown increasingly important: the buying and selling of gold by central banks themselves. Central banks hold gold as part of their official reserves, and their collective behavior, whether they are net buyers or net sellers over time, represents a large and relatively price-insensitive source of demand or supply that operates on a multi-year horizon rather than a trading timeframe. When central banks are persistent net buyers of gold, often to diversify their reserves away from any single currency, they create a structural floor of demand that can support the metal's price over long periods, independent of the shorter-term swings driven by real rates and the dollar. This kind of demand does not show up on a price chart directly, but it forms part of the deep backdrop that an expert holds in mind when assessing gold's longer-term trend. While central bank flows are far too slow to time any individual trade, they help explain why gold can maintain a firm long-term uptrend even through periods when the shorter-term real-rate and dollar signals would suggest weakness, and ignoring this structural layer can leave a trader puzzled by gold's resilience or persistence at times when the cyclical drivers alone do not seem to justify it.
This structural demand also interacts with the other drivers in important ways. Persistent central bank buying can cushion gold's declines during periods of rising real rates, making corrections shallower than they would otherwise be, while its absence can allow declines to run deeper. An expert therefore treats central bank behavior as part of the slow-moving context that sets the stage on which the faster real-rate and dollar dynamics play out, another layer in the confluence picture rather than a timing tool in its own right.
Combining COT extremes with price structure
Returning to the COT report, it is worth examining more closely how an expert combines positioning data with price structure, since the two together are far more powerful than either alone. Extreme speculator positioning, on its own, is a weak signal that can persist for a long time, but when an extreme in positioning coincides with a meaningful technical event on the price chart, the combination becomes much more informative. Consider a situation where large speculators have built an extremely net-long position in gold futures, indicating a crowded bullish trade, and the price simultaneously fails to make a new high despite the crowded positioning, instead forming a lower high or breaking a trendline. That confluence, extreme bullish positioning combined with deteriorating price structure, is a far stronger warning of a potential reversal than either signal alone, because it suggests the crowd of buyers is exhausted and the price is beginning to confirm it. The same logic applies at bottoms, where extreme net-short positioning combined with a price that refuses to make new lows can signal that the selling is exhausted.
This is the disciplined way to use COT data: not as a standalone contrarian trigger, which would have a trader fighting strong trends repeatedly, but as a measure of how stretched the fuel supply for a trend has become, to be acted on only when the price structure itself begins to confirm that the stretch is resolving. An expert who waits for that confluence of crowded positioning and confirming price action avoids the classic trap of betting against a trend simply because positioning looks extreme, a mistake that can be very costly since extremes can become more extreme for a long time before they finally resolve. Positioning sets up the possibility; price action provides the trigger.
Integrating the advanced tools
The expert gold trader integrates these advanced tools into a layered, coherent process rather than treating any one as decisive. At the foundation sits price-based technical analysis, the trends, levels, and risk management from the Foundation series, which defines the actual entries, stops, and targets, since price is what is ultimately traded. On top of that sits the macro picture, dominated by real interest rates, which explains the deep direction of the gold trend and unifies the dollar and rate relationships into a single organizing idea. Layered alongside is the positioning data from the COT report, which gauges how stretched and crowded sentiment has become. And as the faintest input, seasonality offers a gentle background tilt. The highest-conviction gold trades are those where these layers align: a technical setup on the chart, supported by a favorable real-rate macro backdrop, with positioning that is not dangerously crowded against the trade, and ideally without a strong seasonal headwind. When the layers conflict, the expert reduces conviction and size, or stands aside, exactly as the confluence principle throughout this series prescribes.
Crucially, none of these advanced tools changes the fundamental discipline. They enrich the trader's understanding of why gold is moving and how stretched the move has become, but the actual trade is still defined by a precise entry, a stop placed where the idea is proven wrong, and a position sized so that being wrong is survivable. The real-rate framework, the COT report, and seasonal patterns make a trader more informed, not more reckless; they are reasons to adjust conviction and size within a disciplined framework, never license to abandon the stop-loss or oversize a position because the macro story feels compelling. The most sophisticated gold analysis in the world is still subordinate to the risk management that keeps a trader in the game, a theme that has run through every track of this series.
The limits of advanced analysis
A final expert perspective is humility about what any of this can deliver. Real interest rates, while gold's deepest driver, are themselves driven by inflation and central bank decisions that are notoriously difficult to forecast, so the real-rate framework explains gold's moves better in hindsight than it predicts them in advance. The COT report reveals positioning but not timing, and extremes can persist far longer than seems reasonable. Seasonality is a weak tendency easily overwhelmed by macro forces. None of these tools, alone or together, can reliably predict gold's next move, and an expert who treats them as a crystal ball rather than as context will be repeatedly humbled. Their genuine value is in building a richer, more probabilistic understanding of the forces at work, which improves the quality of decisions over many trades, not in delivering certainty on any single one. This honest acknowledgment of limits, paired with disciplined execution, is itself a mark of expertise, and it echoes the central message of this entire series: technical and macro analysis improve the odds, while risk management ensures survival long enough for those improved odds to matter.
Practical guidelines
Focus on real, inflation-adjusted interest rates as gold's deepest driver: gold tends to rise when real rates fall and struggle when real rates rise, which unifies the dollar and rate relationships.
Use the weekly COT report to gauge how stretched speculator positioning has become, treating extreme net-long positioning as a sign of a possibly crowded trade, while remembering it is a lagging, contextual tool, not a timing signal.
Treat seasonality as the faintest of inputs, a gentle background tilt easily overwhelmed by macro forces, never a reason to trade against the chart or the real-rate backdrop.
Integrate the tools in layers: price-based technical analysis defines the trade, the real-rate macro picture explains the direction, COT gauges crowding, and seasonality offers a mild tilt.
Keep all advanced analysis subordinate to risk management; these tools adjust conviction and position size within a disciplined framework, never license to abandon stops or oversize positions.
This completes the gold and commodities track, and with it the market-specific tracks of this series. Taken together, the three gold articles show that the metal rewards exactly the disciplined, structured approach built throughout this series, applied with an understanding of gold's distinctive character: its safe-haven role and chart-readability covered for beginners, its powerful relationship with the dollar covered at the intermediate level, and the real interest rates, positioning data, and seasonal patterns covered here. The trader who brings both technical discipline and this macro understanding to gold is equipped to navigate one of the world's oldest and most closely watched markets with genuine skill rather than relying on its reputation as a simple safe haven.
Key takeaways
Real interest rates, the nominal rate minus inflation, are arguably gold's single most important long-term driver: gold tends to rise when real rates fall and struggle when they rise.
The real-rate framework unifies gold's drivers, explaining the safe-haven, dollar, and interest rate relationships as expressions of a single organizing idea, and it illuminated the real GLD decline driven by rising real-rate expectations.
The weekly COT report reveals how trader groups are positioned, with extreme speculator positioning sometimes preceding reversals, though it is a lagging, contextual tool rather than a timing signal.
Gold seasonality is a weak, probabilistic tendency easily overwhelmed by macro forces, useful only as a faint background tilt and never as a reason to override the chart or macro picture.
These advanced tools enrich understanding and adjust conviction and size, but they remain subordinate to the risk management that keeps a trader in the game, the central message of this entire series.
Disclaimer
This article is for educational purposes only and does not constitute financial or investment advice. The GLD example used here is real historical data shown for illustration and is not a recommendation to buy or sell any security or commodity. The real-yield, COT, and seasonality diagrams are schematic illustrations with illustrative values. Past patterns, including seasonal tendencies and positioning data, do not guarantee future results. Always do your own research and consider consulting a licensed financial advisor before trading or investing.