
INTERMEDIATE LEVEL
Position Sizing and Risk-Reward Ratios: A Practical Framework
Two traders can look at the exact same chart, draw the exact same support and resistance levels, and agree completely on the direction of the trend, and still end up with wildly different results over a year of trading, purely because of how much they risk on each individual position. Position sizing and risk-reward ratios are the part of technical analysis that has nothing to do with predicting price and everything to do with making sure a string of correct predictions actually turns into real, durable profit. This article builds directly on the risk management basics covered earlier and goes deeper into the actual arithmetic, using the same real SPY example.
Risk-reward ratio, defined precisely
The risk-reward ratio compares how much you stand to lose if a trade hits its stop to how much you stand to gain if it hits its target, both measured in price distance from your entry. A trade with a $5 stop-loss distance and a $10 target distance has a 1:2 risk-reward ratio, meaning you are risking one dollar for every two dollars of potential reward. This single ratio is one of the most important numbers in speculation, because it determines how often you actually need to be right to make money over time, a fact many beginners never calculate explicitly.
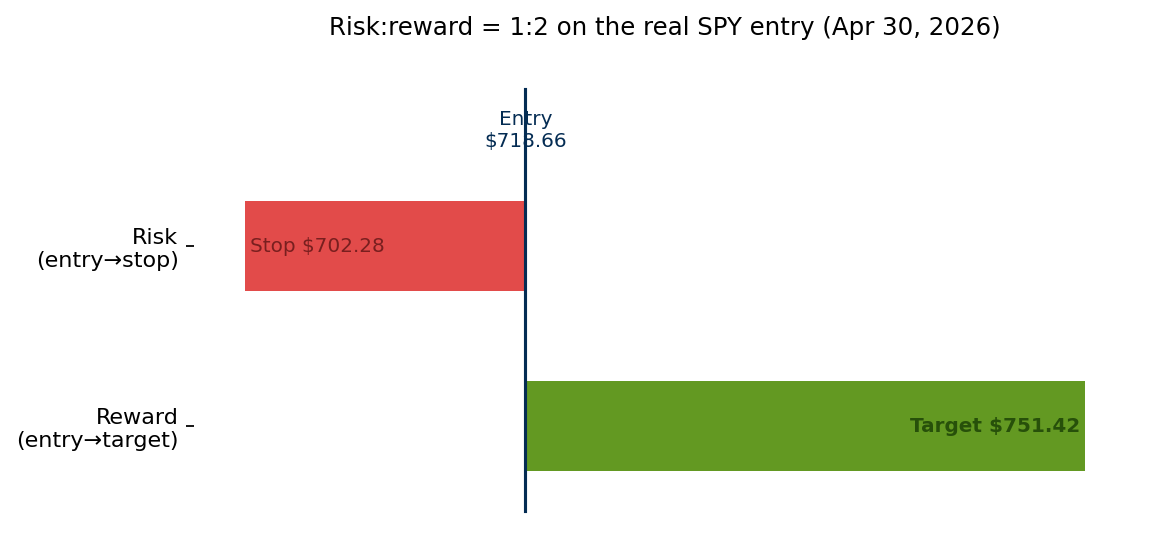
Illustrative risk:reward diagram using the entry, stop, and target from the real SPY example (Apr 30, 2026) introduced in the risk management article.
This diagram revisits the exact numbers from the risk management article: an entry at $718.66, a stop at $702.28, and a target at $751.42, derived from a 2:1 ratio applied to the $16.38 risk distance. The red bar shows the risk, the green bar shows the reward, and the visual size difference is the entire point: a trade like this only needs to win about a third of the time to break even, a dramatically lower bar than most beginners assume is required for profitability.
The breakeven win rate formula
Every risk-reward ratio implies a minimum win rate required just to break even, before any actual trading edge is added. The formula is straightforward: breakeven win rate equals 1 divided by (1 plus the reward-to-risk ratio). For a 1:1 ratio, the breakeven win rate is 50 percent. For a 1:2 ratio, like the SPY example above, it is 1 divided by 3, or roughly 33 percent. For a 1:3 ratio, it drops to 25 percent. This is precisely why experienced speculators obsess over risk-reward ratios rather than win rate alone: a strategy that wins only 40 percent of the time but consistently achieves 1:2 or better is solidly profitable over time, while a strategy that wins 60 percent of the time but risks twice as much as it targets on each trade can still lose money.
Position sizing: turning risk percentage into an actual share count
Position sizing connects your account-level risk tolerance, covered earlier as roughly one to two percent of capital per trade, to the specific number of shares or units you actually buy on any individual setup. The formula is: position size equals (account size multiplied by risk percentage) divided by (entry price minus stop price).
Applying this to the real SPY example: a trader with a $50,000 account risking 1 percent per trade has a maximum dollar risk of $500 on any single position. Using the SPY entry and stop from above, $718.66 and $702.28, the per-share risk is $16.38. Dividing $500 by $16.38 gives approximately 30 shares. Notice that this number depends entirely on where the stop is placed; a wider stop, chosen because a more distant support level made more technical sense, automatically reduces the position size to keep the dollar risk constant, while a tighter stop allows a larger position for the same dollar risk. This is precisely why stop placement has to come before position sizing rather than the other way around.
Why a fixed dollar risk per trade matters more than a fixed share count
A common beginner mistake is trading a fixed number of shares, for example always buying 100 shares regardless of the setup, rather than calculating share count fresh for every trade based on where the stop needs to sit. Fixed share counts mean a trade with a tight stop risks far less than a trade with a wide stop, even though both might feel equally sized on the surface. With a high-priced instrument like SPY, this matters even more, since 100 shares would represent over $70,000 of exposure, far beyond what most accounts should commit to one idea. Calculating position size from a fixed percentage of capital, recalculated for every trade based on that trade's specific stop distance, keeps risk genuinely consistent across very different setups.
Comparing two ratios side by side
It is worth seeing the breakeven math applied to more than one ratio side by side, since the difference is larger than most beginners expect. At a 1:1 ratio, you need to win essentially half your trades just to break even, and any real profit depends entirely on whatever edge pushes your actual win rate above 50 percent. At a 1:3 ratio, the breakeven win rate drops to 25 percent, meaning a strategy could be wrong three times out of every four and still come out ahead, provided the one winner each cycle reliably captures the full three-unit reward. This is why many experienced swing traders deliberately seek out setups with a 1:2 or better ratio, even though such setups often look less immediately obvious than a tighter, more symmetric-looking trade; the lower win rate required to profit more than compensates for taking a setup that triggers somewhat less frequently. The trade-off is that more generous ratios usually require a more distant target, which takes longer to reach and gives price more time to invalidate the idea before getting there.
Scaling into and out of a position
The position sizing formula assumes a single entry and exit, but experienced traders frequently scale, entering a portion at the initial signal and adding the remainder if price confirms, or exiting a portion at an initial target while letting the rest run with a trailing stop. Scaling in can reduce the average entry price's sensitivity to a single mistimed entry, though it requires recalculating the blended stop distance and overall risk across all the scaled-in pieces to keep total dollar risk consistent. Scaling out lets a trader bank partial profits at a high-confidence first target while still participating in a larger move, a natural fit for the measured pattern targets covered in the chart patterns article, which can serve as a logical first scale-out point even when the ultimate target sits further away.
Expectancy: combining win rate and risk-reward into one number
The single most useful number for evaluating a strategy over time combines win rate and risk-reward ratio into one figure called expectancy, calculated as (win rate times average win size) minus (loss rate times average loss size), typically expressed in units of risk per trade. A strategy that wins 40 percent of the time with an average 1:2 ratio has an expectancy of (0.40 times 2) minus (0.60 times 1), which works out to 0.8 minus 0.6, or positive 0.2 units of risk per trade on average. A strategy with positive expectancy, however modest, tends to compound profitably over many trades when position sizing is consistent; a strategy with negative expectancy loses money over time no matter how disciplined the sizing, since risk management controls the size of inevitable losses but cannot turn a fundamentally unprofitable approach into a profitable one.
A brief note on the Kelly criterion
Mathematically inclined traders sometimes encounter the Kelly criterion, a formula originally developed for gambling and information theory that calculates the theoretically optimal fraction of capital to risk per bet given a known win rate and payoff ratio. In practice very few disciplined speculators use the full Kelly fraction directly, for two reasons. First, the formula assumes you know your true win rate and risk-reward ratio with precision, when in reality both are only ever estimated from a limited, noisy sample of past trades. Second, full Kelly sizing produces position sizes most traders find emotionally unbearable, since it is optimal in the long run but accepts very large short-term swings in account value. Many who use Kelly-style thinking at all use a fraction of it, often a quarter or a half of the calculated value, sacrificing some theoretical growth for a much smoother, more psychologically sustainable equity curve.
The hidden cost of inconsistent sizing
One of the most underappreciated ways traders sabotage themselves is by sizing positions according to how confident they feel rather than according to a consistent rule, a habit that quietly corrupts the entire statistical foundation of their trading. The problem is that the trades a trader feels most confident about are not reliably the ones that work out best; confidence is heavily influenced by recency, by how a similar recent trade went, and by emotional state, none of which actually predict the outcome of the next trade. A trader who doubles their normal size on high-conviction trades and halves it on low-conviction ones will find, over a large enough sample, that their results are dominated by the outcomes of their largest positions, which were chosen by feeling rather than by any genuine edge. Consistent sizing, by contrast, ensures that the law of large numbers can actually work in your favor: each trade contributes roughly equally to the overall result, so a real statistical edge across many trades reliably compounds instead of being drowned out by the random outcomes of a few oversized bets.
Drawdowns and the psychology of position sizing
A drawdown is the decline in account value from a previous peak, and understanding drawdowns is essential to choosing a risk percentage you can actually live with. Even a genuinely profitable strategy experiences drawdowns, sometimes lasting weeks or months, as losing trades cluster together by ordinary chance. The mathematics of recovery is unforgiving and worth internalizing: a 10 percent drawdown requires an 11 percent gain to recover, but a 50 percent drawdown requires a 100 percent gain just to get back to even. This asymmetry is the deepest reason disciplined position sizing matters, because keeping per-trade risk small keeps the inevitable drawdowns shallow enough to recover from in a reasonable time. It also matters psychologically: a trader who sizes positions so large that a normal losing streak produces a frightening drawdown is far more likely to abandon a sound strategy at exactly the wrong moment, turning a temporary, recoverable dip into a permanent exit from an approach that would have worked.
Practical guidelines
Calculate the risk-reward ratio for every setup before entering, and have a clear reason, usually the next resistance or support level, for where the target sits.
Know your strategy's breakeven win rate at your typical risk-reward ratio, and track your actual win rate over time to see whether you are clearing that bar.
Recalculate position size for every individual trade based on that trade's specific stop distance; never default to a fixed share count out of habit, especially with high-priced instruments like SPY.
Resist increasing position size after a winning streak or decreasing it after a losing streak; the percentage risked per trade should stay consistent regardless of recent results.
Remember a strategy with a lower win rate but a strong risk-reward ratio can comfortably outperform one with a higher win rate but a weak ratio; calculate both before judging a strategy by win rate alone.
Key takeaways
The risk-reward ratio compares the price distance to your stop against the distance to your target, and directly determines the win rate needed to break even.
Breakeven win rate equals 1 divided by (1 plus the reward-to-risk ratio); a 1:2 ratio needs roughly 33 percent to break even before any edge is added.
Position size equals (account size times risk percentage) divided by (entry minus stop); in the real SPY example, a $50,000 account risking 1 percent with a $16.38 stop distance sizes to about 30 shares.
Calculating position size fresh for every trade keeps dollar risk consistent even though share counts vary, which matters especially for a high-priced instrument like SPY.
Expectancy combines win rate and risk-reward into one number; a positive-expectancy strategy compounds over many trades, while disciplined sizing cannot rescue a negative-expectancy one.
Disclaimer
This article is for educational purposes only and does not constitute financial or investment advice. The position sizing and risk-reward calculations shown here use illustrative numbers based on real historical SPY data and are not a recommendation to buy or sell any security. Always do your own research and consider consulting a licensed financial advisor before trading or investing.