
EXPERT LEVEL
On-Chain Data Meets Technical Analysis
Cryptocurrency offers technical analysts something no traditional market can: a complete, public, real-time record of activity on the asset itself. Every Bitcoin transaction is recorded permanently on the blockchain, a transparent public ledger that anyone can examine. This gives rise to on-chain analysis, the study of blockchain data to gauge what participants are actually doing with their coins, as opposed to merely what the price is doing. For an expert-level crypto trader, on-chain data is a genuinely additional dimension that can be layered on top of the price-based technical analysis covered throughout this series. This article explains what on-chain analysis is, how it complements traditional technical analysis, and, crucially, where its limits lie.
As in the rest of this crypto track, the real price data here comes from the iShares Bitcoin Trust (IBIT), a spot Bitcoin ETF, covering April to June 2026. On-chain metrics themselves describe the underlying Bitcoin network rather than the ETF, but the price behavior of the two is closely linked, since the ETF holds actual Bitcoin.
What on-chain data actually measures
Traditional technical analysis studies price and volume, the footprints of buying and selling. On-chain analysis studies the activity recorded directly on the blockchain, which offers a different and complementary view. Some of the most widely followed on-chain metrics include the number of active addresses, a rough proxy for how many participants are actually using the network; exchange inflows and outflows, which track whether coins are moving onto exchanges, often interpreted as preparation to sell, or off exchanges into private wallets, often interpreted as intent to hold; and the behavior of long-term holders versus short-term holders, which can reveal whether seasoned participants are accumulating or distributing. None of these has any equivalent in a stock market, where you cannot see who is holding shares in their brokerage account or moving them in preparation to sell.
Why on-chain data complements, rather than replaces, price analysis
The temptation for a newcomer to on-chain analysis is to treat it as a superior crystal ball that overrides price action. This is a mistake. On-chain data is best understood as an additional, independent source of evidence that is most powerful when it agrees with what price-based technical analysis is already suggesting, the same principle of confluence that runs throughout this entire series. When a price chart shows a support level holding and on-chain data simultaneously shows coins flowing off exchanges into long-term storage, the two independent signals reinforce each other, a stronger basis for a view than either alone. When they disagree, that disagreement is itself valuable information, a signal for caution rather than a clear instruction.
On-chain divergence: the key concept
The most useful single idea in combining on-chain data with technical analysis is divergence, conceptually similar to the RSI divergence covered in the Foundation moving averages and RSI article, but using on-chain metrics instead of a price-derived indicator. On-chain divergence occurs when the price is doing one thing while an on-chain metric is doing the opposite, suggesting that the underlying behavior of participants may not match the surface-level price move.
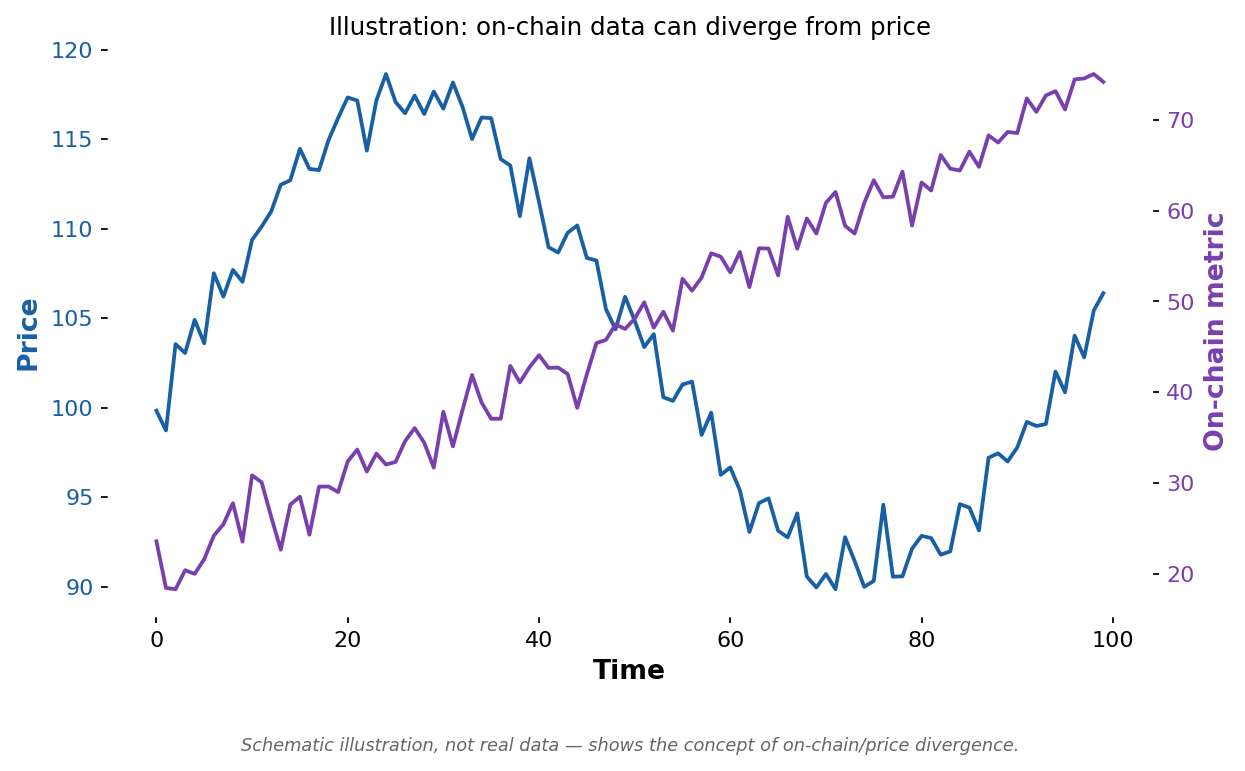
Schematic illustration, not real market data, showing the concept of on-chain data diverging from price.
The schematic above illustrates the concept: while the price falls and then recovers, an on-chain accumulation metric, for example coins steadily moving into long-term-holder wallets, rises persistently throughout. This kind of divergence is what on-chain analysts find most interesting. If price is falling while a credible accumulation metric is rising, it may suggest that seasoned, longer-term participants are quietly buying into the weakness even as the price discourages short-term traders, a potentially bullish underlying signal that pure price analysis would miss. The reverse, a rising price accompanied by coins flowing onto exchanges and long-term holders distributing, may warn that the rally is being sold into and is weaker than it looks. As with every signal in this series, divergence is a probabilistic hint to investigate further, not a guarantee, and it works best as one input among several rather than a standalone trigger.
Reading a real decline through both lenses
Consider the real IBIT decline from this crypto track through the combined lens of price and on-chain thinking.
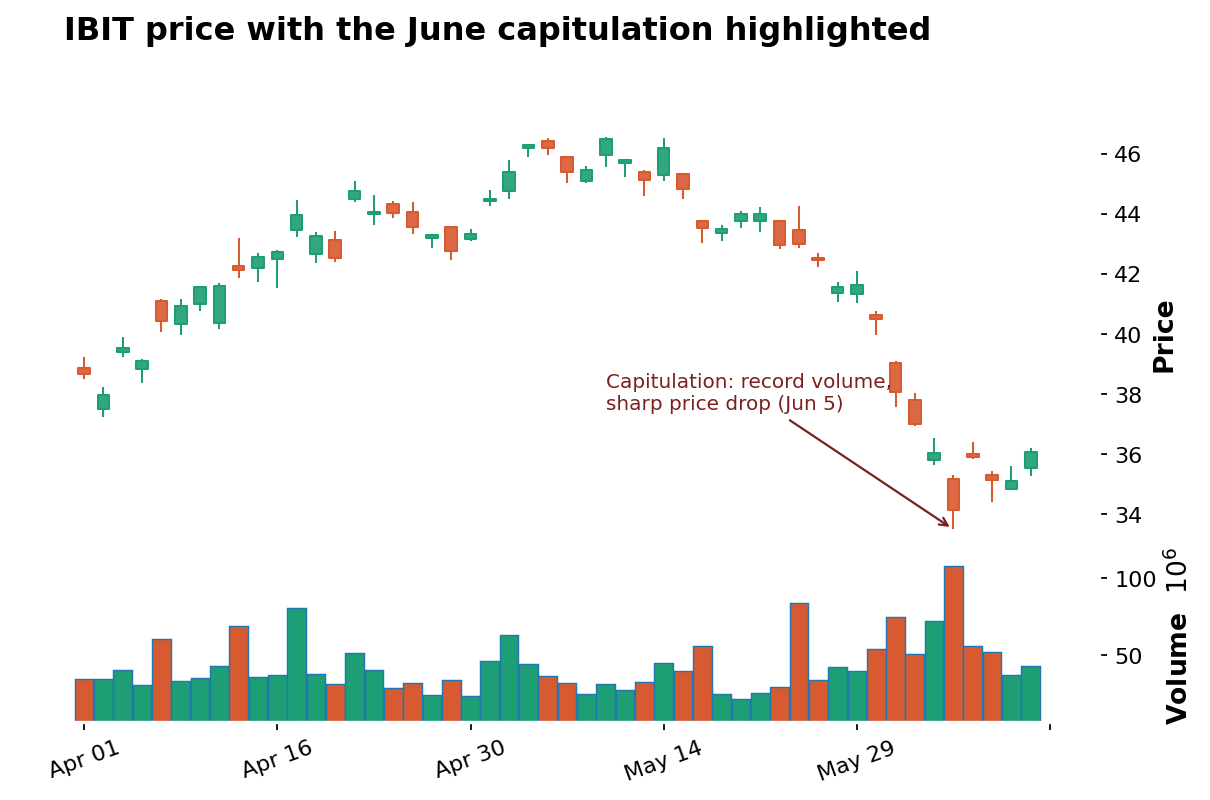
Data: stockanalysis.com (S&P Global), IBIT daily candles, Apr 1 – Jun 11, 2026.
From a pure price perspective, this chart shows a clear decline accelerating into the June 5 capitulation, the sharp drop on the heaviest volume of the period, visible in the volume panel. The price evidence alone tells a story of intensifying selling pressure climaxing in a high-volume flush. An on-chain analyst would overlay additional questions onto this picture: during that capitulation, were coins flooding onto exchanges, confirming panic selling, or were long-term holders quietly absorbing the sold coins, which would hint that the weak hands were being shaken out and stronger hands were accumulating? Were the addresses doing the selling predominantly short-term holders who had bought recently near the highs, the classic profile of capitulation, or seasoned long-term holders, which would be a more genuinely bearish signal? These questions cannot be answered from the price chart alone, and they are precisely where on-chain data adds a dimension. A high-volume capitulation accompanied by on-chain evidence of long-term-holder accumulation has historically been read by many analysts as a potential sign of a bottoming process, whereas the same price drop accompanied by long-term holders distributing would carry a much more bearish implication.
The serious limits of on-chain analysis
On-chain analysis is genuinely powerful, but it comes with real limitations that an expert must respect rather than gloss over. On-chain metrics are interpretive, not precise; the same exchange inflow can reflect selling, or simply coins being moved for custody or operational reasons, and distinguishing the two requires judgment and is often genuinely ambiguous. Many on-chain metrics are also noisy and prone to misinterpretation, and a metric that appeared to predict one market turn can fail completely at the next. The data can be manipulated to a degree, since a single large holder can create misleading on-chain signals through their own transactions. And critically, on-chain analysis is unique to crypto and does not transfer to any other market, which means it is an advanced specialization rather than a foundational skill. For all these reasons, on-chain data should be treated as a supplementary layer of evidence that enriches price-based technical analysis, never as a replacement for the disciplined risk management and price reading that the rest of this series is built on.
A closer look at exchange flows and holder cohorts
Two families of on-chain metrics deserve a closer look because they are among the most widely used and the most intuitive. Exchange flows track the movement of coins onto and off of trading exchanges. The common interpretation is that large inflows to exchanges suggest holders are positioning to sell, since coins generally need to be on an exchange to be sold there, while large outflows suggest holders are moving coins into private storage with the intent to hold for the longer term. Sustained outflows during a price decline are often read as a constructive sign, hinting that participants are accumulating into weakness rather than capitulating. The second family, holder-cohort analysis, divides the supply by how long coins have been held without moving, distinguishing long-term holders, who have held through volatility and tend to represent seasoned conviction, from short-term holders, who bought recently and tend to have weaker hands. When long-term holders are accumulating while short-term holders are selling, as frequently happens near the end of a decline, on-chain analysts often interpret this as the weak hands transferring coins to strong hands, historically associated with bottoming processes, though never with certainty.
Why transparency cuts both ways
The radical transparency of the blockchain is on-chain analysis's greatest strength, but it also creates subtleties worth understanding. Because every transaction is public, sophisticated participants are aware that their on-chain activity can be observed and interpreted, which means large players can, in principle, create deliberately misleading signals, for example by moving coins in ways designed to look like accumulation or distribution to influence others. Furthermore, the rise of custodial services, ETFs like the one used as this article's price example, and complex financial products means that a growing share of Bitcoin exposure is held in ways that do not generate the straightforward on-chain signals the early metrics were designed around. A coin held inside an ETF, for instance, does not move on-chain when shares of the ETF change hands. This does not invalidate on-chain analysis, but it does mean the metrics must be interpreted with an awareness that the structure of the market is evolving, and that signals which worked cleanly in an earlier, more retail-driven era may behave differently as institutional and custodial holdings grow.
Combining the two disciplines in practice
An expert crypto trader who uses both disciplines typically lets price-based technical analysis define the actionable structure, the trends, levels, entries, stops, and targets, exactly as taught throughout this series, and uses on-chain data as a confirming or cautioning overlay that adjusts conviction and position size rather than generating trades on its own. A high-probability setup might be one where the price chart shows a clean entry near genuine support, the risk-reward ratio is favorable, and on-chain data independently shows accumulation rather than distribution, three separate factors pointing the same way. When the on-chain picture contradicts the price setup, the disciplined response is usually to reduce size or stand aside rather than to abandon the price-based plan entirely, since price remains the thing you actually trade and the thing your stop-loss is defined against.
Practical guidelines
Treat on-chain data as an additional, independent source of evidence that complements price analysis, not as a superior signal that overrides the chart.
Look for confluence: the strongest setups are those where price structure and on-chain data point the same direction at once.
Pay particular attention to on-chain divergence, where price and an on-chain metric disagree, as a hint to investigate further, while remembering it is probabilistic, not predictive.
Respect the real limits of on-chain analysis: metrics are interpretive and noisy, can be ambiguous or manipulated, and do not transfer to any other market.
Let price-based technical analysis define your actual entries, stops, and targets, and use on-chain data to adjust conviction and position size rather than to generate trades by itself.
This completes the crypto track. Taken together, the three articles show that crypto rewards exactly the disciplined, structured approach built throughout this series, the same support and resistance, trends, risk management, and psychology, applied with respect for crypto's far higher volatility and round-the-clock nature, and enriched, for those willing to specialize, by the unique transparency of on-chain data. The market is faster and wilder than traditional assets, but it is not lawless, and the trader who brings discipline to it is far better equipped than the one who brings only enthusiasm.
Key takeaways
On-chain analysis studies the public blockchain record, active addresses, exchange flows, and holder behavior, offering a dimension of evidence that has no equivalent in traditional markets.
It complements rather than replaces price-based technical analysis, and is most powerful when the two independent sources of evidence agree, the same confluence principle used throughout this series.
On-chain divergence, where price and an on-chain metric move in opposite directions, is the key combined concept, analogous to RSI divergence but using blockchain data.
On-chain analysis has serious limits: metrics are interpretive, noisy, sometimes ambiguous or manipulable, and do not transfer to any other market, making it an advanced specialization.
In practice, let price analysis define entries, stops, and targets, and use on-chain data to adjust conviction and size, never as a standalone trade trigger.
Disclaimer
This article is for educational purposes only and does not constitute financial or investment advice. Cryptocurrency is a highly volatile and speculative asset class, and you should never invest more than you can afford to lose entirely. The IBIT example used here is real historical data shown for illustration and is not a recommendation to buy or sell any security or cryptocurrency. The on-chain divergence diagram is a schematic illustration, not real market data. On-chain metrics are interpretive tools, not precise predictors. Always do your own research and consider consulting a licensed financial advisor before trading or investing.