
INTERMEDIATE LEVEL
Moving Averages and RSI: Stacking Indicators for Better Entries
Once you can read a plain price chart, identify support and resistance, and recognize a trend with your own eyes, indicators stop being magic black boxes and start being what they actually are: math performed on the same price data you are already looking at, designed to make certain patterns easier to see at a glance. This article covers the two most widely used indicators in all of technical analysis, the moving average and the Relative Strength Index, known as RSI, and shows how they combine, using real, calculated QQQ data, not a hypothetical.
Moving averages: smoothing out the noise
A simple moving average takes the closing price of the last N periods and averages them, then plots that single number, recalculated fresh for every new period as old data drops off and new data is added. A 20-day simple moving average on a daily chart is the average closing price of the most recent 20 trading days, updated daily. The effect is a smoothed line that filters out short-term noise and makes the underlying direction easier to see than the jagged candles alone would allow.
Shorter moving averages, such as a 10-day average, react quickly to recent price changes but stay noisy. Longer moving averages, such as a 50-day or 200-day average, are far smoother but lag well behind sharp turns. Most traders do not pick one length and stop there; they use the moving average's slope and its relationship to price as two complementary signals.
RSI: measuring how stretched a move has become
The Relative Strength Index, developed by J. Welles Wilder, measures the speed and size of recent price changes on a scale from 0 to 100. It is calculated from the average size of up-moves versus down-moves over a chosen lookback period, almost always 14 periods by default. The practical reading is simpler than the formula: RSI above 70 is traditionally considered overbought, suggesting a rally may have moved further or faster than is sustainable in the near term, while readings below 30 are considered oversold, suggesting a decline may be overdone. RSI does not measure trend direction by itself; it measures momentum, the rate of change, which is a genuinely different piece of information.
Both indicators, calculated on real data, together
Here is a 20-day simple moving average and a 14-day RSI, both calculated directly from the real QQQ closing prices used in this series, from April to June 2026.
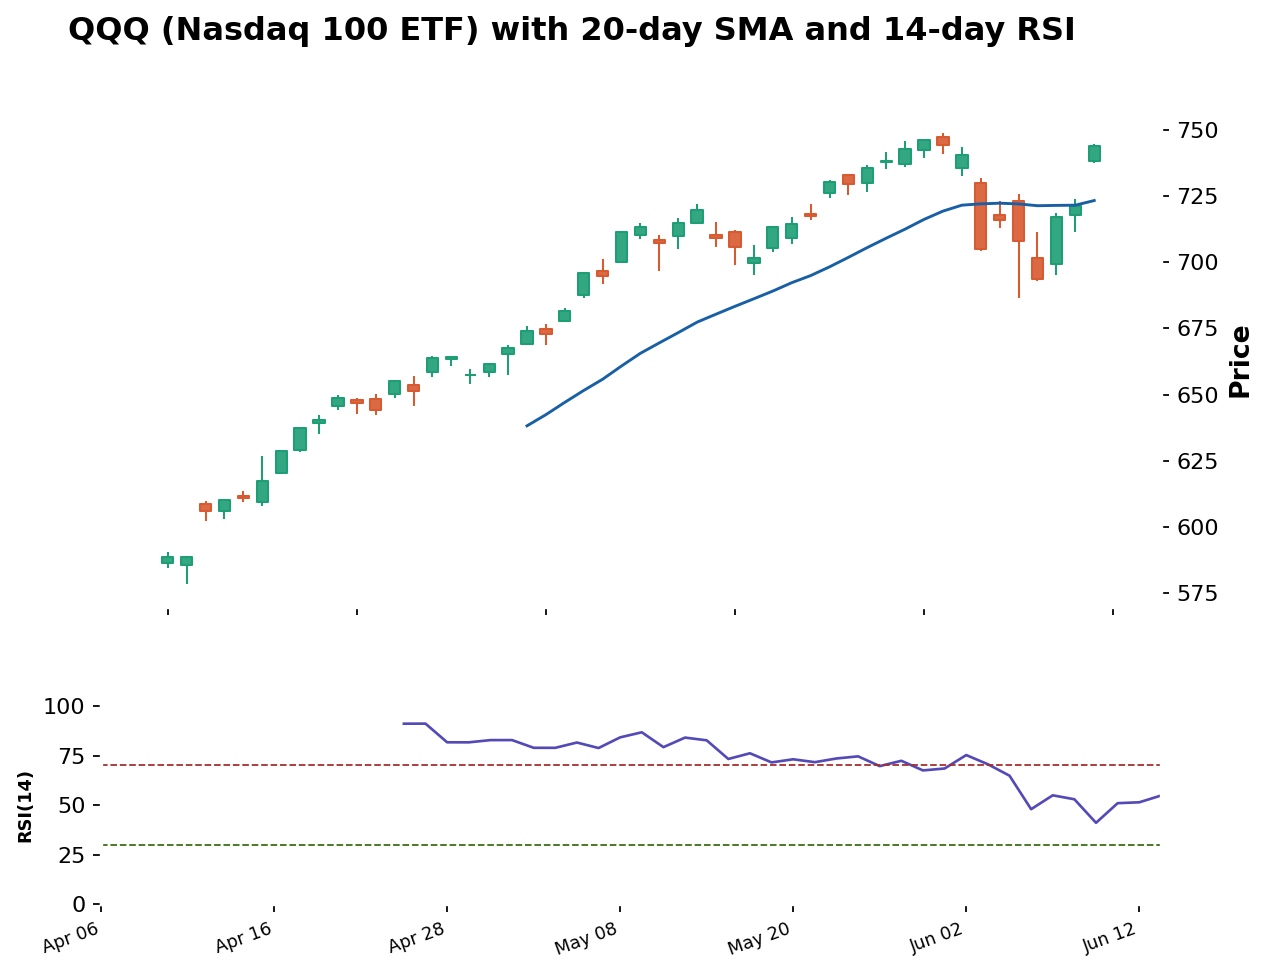
Data: stockanalysis.com (S&P Global), QQQ daily closes, Apr 6 – Jun 15, 2026. 20-day SMA and 14-day RSI calculated from this data.
Several real, calculated details stand out. The 20-day moving average only begins partway through the chart, because a 20-day average genuinely needs 20 prior closes before it can first be calculated; this is a real constraint of the indicator, not a charting limitation. Through the strong April and May rally, price trades above the rising moving average, consistent with the uptrend, and the average itself slopes upward, confirming the same conclusion from a different angle. The RSI climbs into deeply overbought territory during the powerful rally, exceeding 90 at its peak, an unusually stretched reading that reflects just how relentless the advance was. It then collapses during the sharp early-June plunge, exactly when price fell hardest, before stabilizing as the market recovered.
How traders actually combine these two tools
Used together, a moving average answers "what is the prevailing direction" while RSI answers "how stretched is the current move within that direction." A common, disciplined approach is to use the moving average as a filter, only considering long entries while price trades above a rising average, and only considering short entries while price trades below a falling average, then use RSI to time entries within that filter, looking for a pullback rather than chasing a price that has already become extremely overbought. On the real chart above, a trader using this approach would have been wary of initiating a fresh long position right as RSI pushed above 90, since such an extreme reading warned the rally was badly stretched and vulnerable to exactly the kind of sharp pullback that followed in June.
Adjusting RSI thresholds for trending markets
The traditional 70 and 30 thresholds work reasonably well in range-bound markets but can mislead during a strong trend. During a powerful uptrend like the QQQ rally shown here, RSI can climb above 70 and stay elevated for an extended stretch without the rally ending, since strong, persistent buying genuinely is an unusual condition by the indicator's normal standards yet remains justified by real ongoing demand. The QQQ data illustrates this directly: RSI spent a long stretch above 70 during the climb, and a trader who shorted simply because RSI crossed 70 would have fought a strong trend for weeks. Many experienced traders adjust their expectations accordingly, treating the 40 to 55 zone as the more meaningful pullback-entry level during a confirmed uptrend rather than waiting for a full retreat to 30 that may never arrive.
Simple versus exponential moving averages
The simple moving average weights every period in its window equally. An exponential moving average, often abbreviated EMA, instead applies progressively more weight to more recent prices, making it react somewhat faster while still smoothing out noise. Neither is objectively superior; simple averages give a clearer read on longer-term structural support and resistance because their slower reaction makes them less prone to whipsawing, while exponential averages are often preferred by shorter-term traders for that faster reaction. Many platforms default to simple moving averages, which is part of why this series leads with that version.
Choosing a moving average length that matches your time horizon
There is no single correct length; the right choice depends on how long you intend to hold. Very short averages, 5 to 10 days, react quickly and suit traders capturing moves lasting days to a couple of weeks, but generate more false signals in choppy conditions. Medium-length averages, 20 to 50 days, including the 20-day average used in the QQQ example, are a common middle ground for swing traders holding positions for several weeks. Long averages, the 100-day and especially the widely watched 200-day, are generally used as a broad, structural gauge of whether an asset is in a primary bull or bear market over many months to years, and are far less useful for the shorter-term entry timing this series focuses on.
Divergence and where MACD fits
One advanced but useful RSI signal is divergence, where price makes a new high but RSI fails to make a correspondingly higher high, suggesting momentum is weakening even as price extends, a warning sign worth watching rather than acting on alone. A third indicator worth knowing about, MACD (Moving Average Convergence Divergence), is built from the relationship between two exponential moving averages and is often used to confirm the momentum shifts RSI also captures. This series introduces moving averages and RSI as the core pairing rather than MACD mainly because RSI's bounded 0-to-100 scale and explicit thresholds are more intuitive for a trader still building foundational skills.
Moving average crossovers and the golden cross
One of the most widely watched moving average signals is the crossover, where a shorter average crosses above or below a longer one. When a shorter average crosses above a longer one, it indicates that recent momentum has turned more positive than the longer-term average, often read as a bullish signal; the reverse, a shorter average crossing below a longer one, is often read as bearish. The most famous version is the so-called golden cross, when the 50-day average crosses above the 200-day average, widely cited in financial media as a long-term bullish milestone, and its bearish counterpart the death cross, when the 50-day crosses below the 200-day. These signals are genuinely useful as broad, slow trend filters, but it is worth understanding their core weakness, which is the same lag that affects every moving average: because they only trigger after a move is already underway, they are late by design. The backtesting article later in this series demonstrates this lag directly, using a real moving average crossover strategy on real index data and showing how that lag caused it to miss the early part of a strong rally.
Why momentum and trend together beat either alone
The deeper reason the moving average and RSI pairing works so well is that they measure genuinely different things and therefore fail in different situations, which means combining them filters out a meaningful share of each one's individual false signals. A moving average can keep you on the right side of a sustained trend but says nothing about whether the current moment is a good entry within that trend; RSI can flag when a move has become stretched but, used alone, constantly tempts you to bet against trends that are perfectly healthy and have plenty of room left to run. Requiring both to agree, a rising moving average confirming the direction and an RSI reading that is not screaming overbought confirming the timing, is more demanding than either signal alone, which is precisely the point: a more demanding filter triggers less often but with better odds on each trigger, the same trade-off between frequency and quality that runs throughout this entire series.
It is also worth remembering that indicators are derived from price, not the other way around, which means price action itself always takes precedence when the two seem to conflict. An indicator is a summary of past prices repackaged into an easier-to-read form; it can never contain information that is not already present in the price and volume data it was calculated from. This is why experienced traders treat indicators as supporting evidence for what they already see in the raw price structure, the trends, levels, and patterns covered earlier in this series, rather than as independent oracles that override the chart. When a moving average or an RSI reading seems to contradict what clear price action is plainly showing, the price action is the more fundamental truth, and the indicator is simply lagging or smoothing it.
Practical guidelines for using these indicators
Treat a moving average as a trend filter first; trade in the direction price sits relative to it before worrying about precise entries.
Use RSI to gauge whether a move is stretched, not to predict reversals by itself. An asset can stay overbought for a long stretch during a genuinely strong trend, exactly as QQQ did during this rally.
Look for RSI to pull back toward the middle of its range, roughly 40 to 55, during an established uptrend as a more favorable entry zone than chasing a fresh overbought reading.
Remember that a moving average is calculated from past prices and will always lag a sharp, sudden turn; it describes where price has been more reliably than where it is going next.
Treat RSI divergence as a caution flag worth combining with other evidence, such as a break of trend or a failure at resistance, rather than as a standalone signal to act on alone.
As with every tool in this series, neither a moving average nor RSI should ever be used in isolation. The real value of both comes from combining them with the support, resistance, and trend concepts covered earlier, and later with chart patterns and multi-timeframe techniques, building toward a single coherent picture rather than reacting to any one signal alone.
Key takeaways
A moving average smooths price into a single trend-following line; shorter averages react faster but noisier, longer averages are smoother but slower.
RSI measures momentum on a 0-100 scale, with readings above 70 traditionally overbought and below 30 oversold.
On the real QQQ data, RSI pushed above 90 at the peak of the rally, an unusually stretched reading, then collapsed during the sharp early-June plunge.
A common disciplined approach uses the moving average to define the tradeable direction and RSI to time entries within it, rather than using either indicator alone.
During strong trends the traditional 70/30 thresholds can mislead, since RSI can stay overbought for weeks; the 40 to 55 zone often marks more useful pullback entries in an uptrend.
Disclaimer
This article is for educational purposes only and does not constitute financial or investment advice. Moving averages and RSI are calculated from historical prices and do not predict future performance. The QQQ example used here is real historical data shown for illustration and is not a recommendation to buy or sell any security. Always do your own research and consider consulting a licensed financial advisor before trading or investing.