INTERMEDIATE LEVEL
Gold and the Dollar: Trading the Macro Relationship
The beginner article in this gold track introduced the metal as a tradeable market and named the three forces that drive it: fear, the US dollar, and interest rates. This intermediate article focuses on the second of those, the relationship between gold and the dollar, because it is one of the most important and reliable macro relationships in all of trading, and understanding it transforms how a technical trader reads a gold chart. Rather than seeing gold's moves as isolated price action, an intermediate trader learns to read them in the context of what the dollar is doing, which adds a powerful layer of confirmation and insight. As throughout this track, the real examples use verified SPDR Gold Shares (GLD) data from April to June 2026.
Why gold and the dollar are linked
The relationship between gold and the US dollar begins with a simple fact: gold is priced in dollars throughout the world. When you see the price of gold quoted, it is quoted in US dollars per ounce. This pricing convention creates a direct mechanical link between the two. When the dollar strengthens, meaning each dollar buys more, it takes fewer dollars to buy the same ounce of gold, which tends to push the dollar price of gold down. When the dollar weakens, it takes more dollars to buy the same ounce, which tends to push the gold price up. This is the foundation of the famous inverse relationship between gold and the dollar.
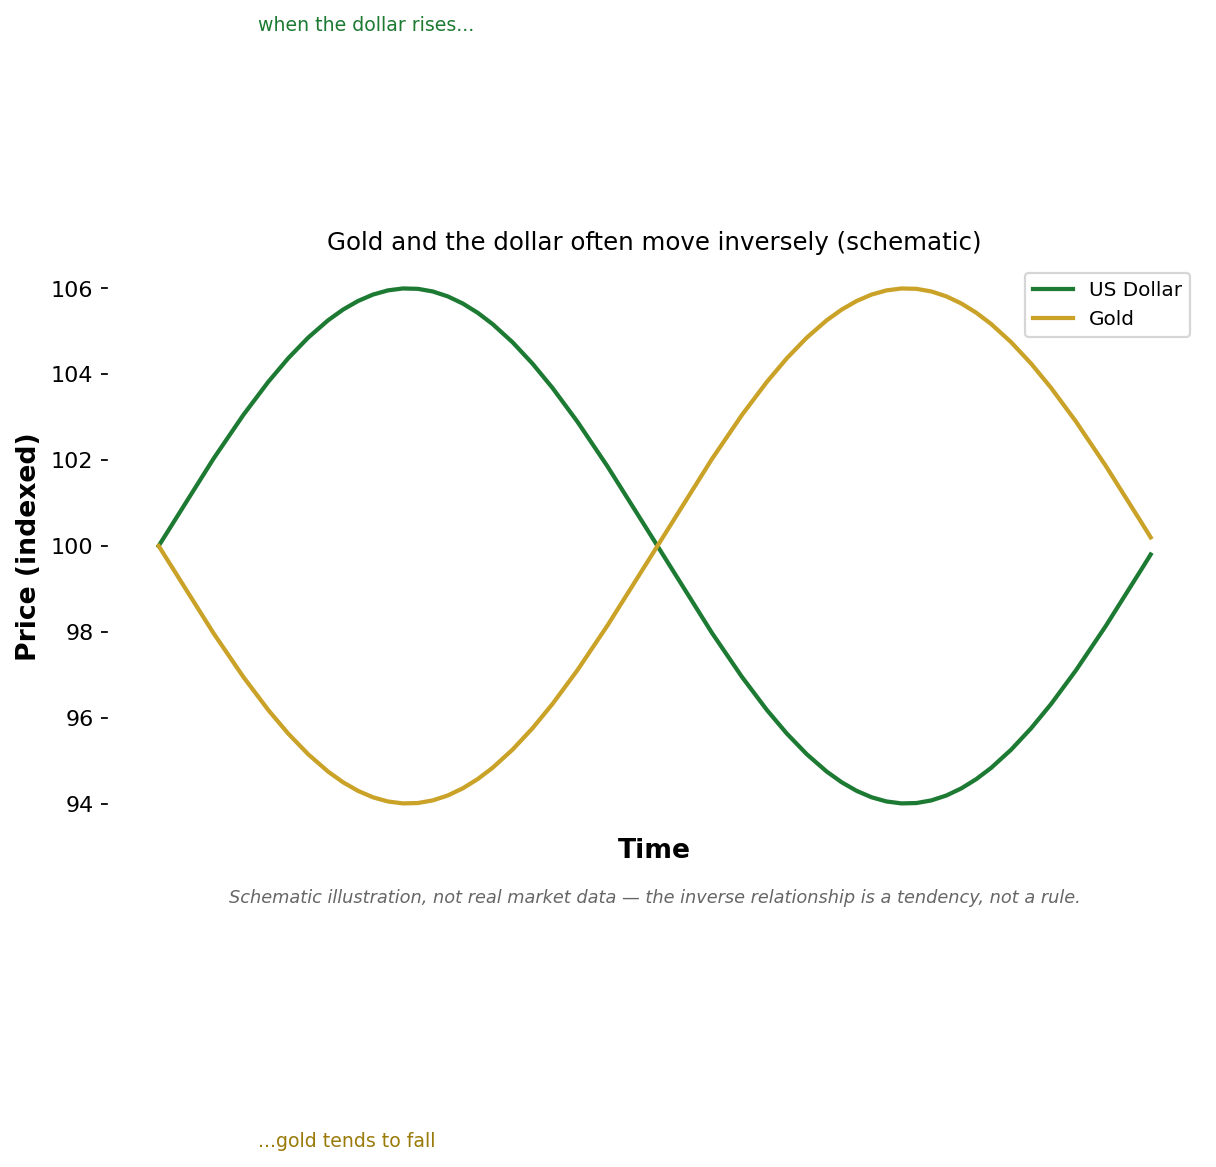
Schematic illustration of the inverse relationship between gold and the dollar, not real market data; the relationship is a strong tendency, not an exact rule.
The schematic above illustrates the tendency: as the dollar rises, gold tends to fall, and as the dollar falls, gold tends to rise, the two tracing roughly mirror-image paths. Beyond the simple pricing mechanism, there is also a behavioral dimension. Both gold and the dollar are considered safe-haven assets, places investors put money during uncertainty, which means they sometimes compete for the same flows of fearful capital. When confidence in the dollar specifically is high, money may favor the dollar over gold; when confidence in the dollar wavers, gold often benefits. This competition reinforces the inverse relationship rooted in the pricing mechanism.
The relationship in real data
The real GLD decline from this track is a textbook example of the gold-dollar relationship in action, and understanding it deepens what the price chart alone shows.
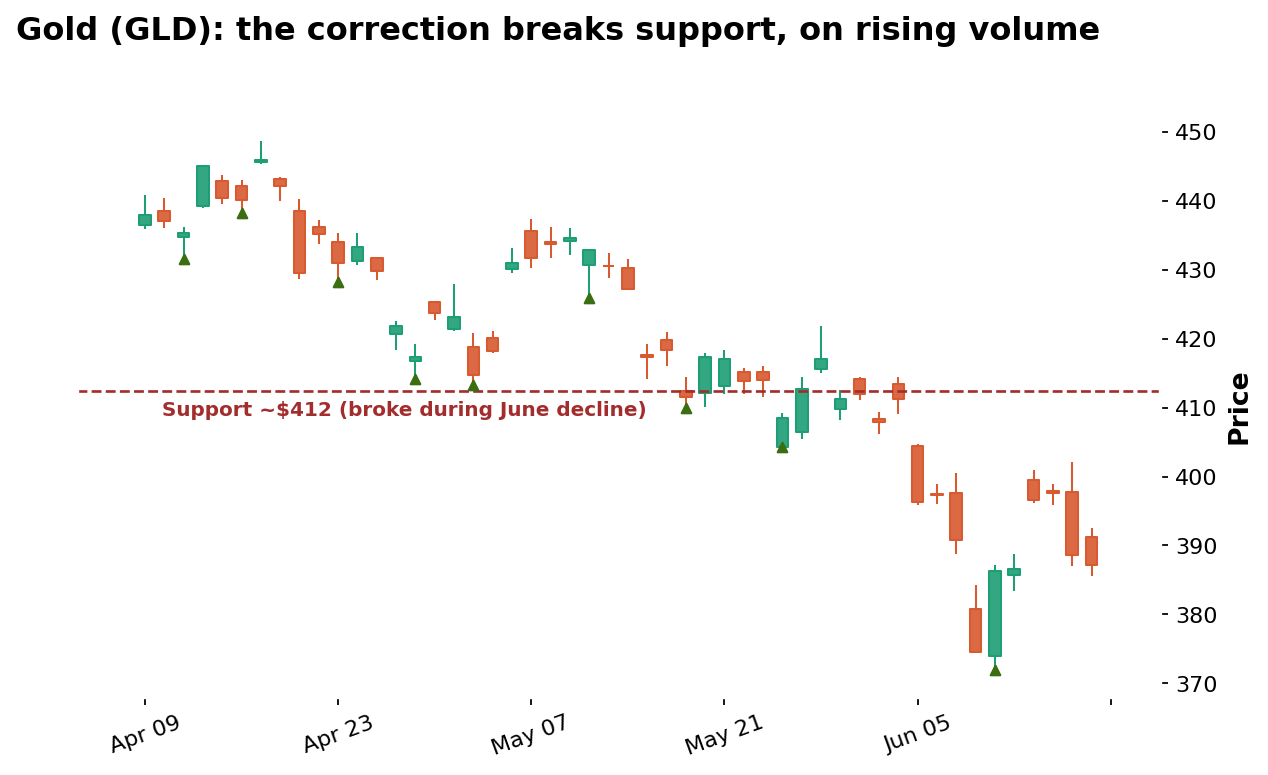
Data: stockanalysis.com (S&P Global), GLD daily candles, Apr 9 – Jun 18, 2026. Support level derived from real detected swing lows.
This chart shows gold's correction, with a support level around $412 marked, derived from the real swing lows where price had repeatedly found a floor, the green triangles, exactly the disciplined, data-driven method established in the Foundation support and resistance article. For weeks through April and May, that support zone broadly held, with gold finding buyers near it on several occasions. Then, in June, the price broke decisively below it and the decline accelerated. According to contemporaneous financial news, this breakdown coincided with the US dollar strengthening to its highest levels of the year, driven by expectations that interest rates would stay higher for longer. To a chart-only trader, this is simply a support break to be traded with the techniques from the Foundation series. To an intermediate trader who understands the gold-dollar relationship, the same break carries a richer meaning: it reflected a powerful, sustained move in the dollar that was pushing against gold the entire time. This deeper reading helps a trader gauge conviction, since a gold breakdown driven by a strong, ongoing dollar trend is more likely to continue than one occurring with no supporting macro force.
Using the dollar as a confirming indicator
The practical power of the gold-dollar relationship is that it gives a gold trader an independent, confirming indicator to consult alongside the gold chart itself, the same principle of confluence that runs throughout this series. Before acting on a technical signal in gold, an intermediate trader checks what the dollar is doing. A bullish setup in gold, a bounce off support, say, is considerably more appealing if the dollar is simultaneously showing weakness or topping out, since a falling dollar provides a tailwind for gold. The same gold setup is far less appealing, and deserves more caution, if the dollar is strengthening powerfully, since that dollar strength is a headwind working directly against the gold trade. When the gold chart and the dollar both point the same way, the two independent signals reinforce each other; when they conflict, that conflict is a warning to reduce conviction, trade smaller, or wait.
Many gold traders watch the US Dollar Index, a measure of the dollar's value against a basket of other major currencies, as their primary dollar gauge. By keeping the dollar index chart alongside the gold chart, a trader can quickly assess whether the macro wind is at gold's back or in its face before committing to a trade, turning the abstract gold-dollar relationship into a concrete, practical checking step. This habit of placing the two charts side by side turns an abstract macro relationship into a concrete, repeatable part of the daily trading routine.
When the relationship breaks down
A crucial intermediate-level insight is that the gold-dollar inverse relationship, while strong and reliable over long periods, is not absolute and can weaken or temporarily break down. There are times when gold and the dollar rise together, typically during episodes of extreme global fear when investors rush into both safe havens simultaneously, abandoning riskier assets like stocks and crowding into anything perceived as safe. In such moments, the usual competition between gold and the dollar is overwhelmed by a broader flight to safety that lifts both at once. There are also periods when gold is driven more by its own specific supply and demand factors, or by interest rate expectations, than by the dollar, causing the relationship to loosen temporarily.
The practical lesson is to treat the gold-dollar relationship as a powerful, reliable tendency to monitor continuously, rather than a mechanical law to depend on blindly. An intermediate trader checks whether the relationship is currently holding, whether gold and the dollar are in fact moving inversely right now, rather than assuming it always will. When the relationship is holding, the dollar is an excellent confirming indicator; when it has temporarily broken down, the trader gives it less weight and leans more heavily on the gold chart's own technical structure and the other drivers. This dynamic, monitor-and-adjust approach mirrors exactly how the forex track treated currency correlations, which are never permanent and must be watched as living relationships.
Interest rates: the force behind both
Lurking behind the gold-dollar relationship is a deeper force that often drives both: interest rates. When a central bank raises interest rates, or signals it will, that tends to strengthen the dollar, because higher rates attract capital seeking better returns, exactly the mechanism described in the forex track. At the same time, higher rates tend to weigh directly on gold, because gold pays no interest, so when safe, interest-bearing assets like bonds offer a higher yield, holding non-yielding gold becomes relatively less attractive. This means a single force, rising interest rate expectations, can push the dollar up and gold down simultaneously, which is precisely the dynamic that drove the real GLD breakdown shown above. Understanding this shared driver helps an intermediate trader see the gold-dollar relationship not as two isolated assets bouncing off each other, but as two expressions of the same underlying macro forces, a perspective the expert article in this track develops in full through the lens of real, inflation-adjusted interest rates.
The strength of the dollar versus other currencies
An important refinement for an intermediate trader is recognizing that the dollar's strength is itself a relative concept, measured against other currencies, which connects the gold-dollar relationship directly to the forex track of this series. The US Dollar Index, the most common gauge, measures the dollar against a basket of major currencies dominated by the euro. This means that when you assess whether the dollar is a tailwind or headwind for gold, you are implicitly assessing the dollar's strength relative to those other currencies. A dollar that is strengthening against the euro and other majors, as it was during the real GLD decline shown in this article, exerts broad downward pressure on gold. But the picture can be more nuanced when the dollar is strong against some currencies and weak against others, in which case the dollar index gives a useful aggregate reading. Understanding this relative nature helps an intermediate trader avoid the trap of thinking about the dollar as a single absolute thing, and instead see it as a measure of the dollar's standing in the global currency system, the same system the forex track examined in detail. The interest rate differentials that drive currency pairs in the forex track are, in many cases, the very same forces driving the dollar's strength against gold, which is why the two markets are so deeply connected.
This connection also explains why major economic releases and central bank decisions, flagged in the forex track as the highest-impact events for currencies, are equally significant for gold. A central bank decision that strengthens the dollar by signaling higher rates simultaneously pressures gold through both the dollar channel and the interest rate channel at once, which is why gold often moves sharply around the same scheduled events that move currencies. An intermediate gold trader therefore watches the same economic calendar that a forex trader watches, since the two markets respond to many of the same catalysts, frequently in mirror-image fashion.
A practical example of reading gold through the dollar
To make the approach concrete, consider how an intermediate trader would have read the real GLD situation shown in this article. The gold chart alone showed a support level around $412 that had held repeatedly through April and May, which a chart-only trader might have viewed as a reasonable place to buy in expectation of another bounce. But an intermediate trader, before taking that long trade, would have checked the dollar and found it strengthening powerfully toward its highs for the year. That observation would have served as a serious warning: a long gold trade at support, taken directly against a powerful, sustained dollar uptrend, faces a strong macro headwind, and the confluence the trader wants, gold support plus a weakening or stalling dollar, was absent. The disciplined response would have been to reduce conviction in the long trade, demand additional confirmation before entering, or stand aside entirely. When gold then broke decisively below the $412 support as the dollar surged, the trader who had respected the dollar's message would have been protected from a losing long trade, while a chart-only trader who bought support in isolation would have been caught in the breakdown. This is the practical power of reading gold through the dollar: it provides an independent check that can keep a trader out of technically reasonable trades that the macro backdrop quietly undermines.
The same logic works in reverse. Had the dollar been topping out and beginning to weaken as gold approached a support level, the confluence of a gold support bounce and a fading dollar would have strengthened the case for a long trade, raising conviction and justifying normal position size. The dollar, in other words, is not merely a source of caution but a genuine two-way confirming indicator, capable of both warning against trades and reinforcing them, which is exactly what makes it so valuable as a companion to the gold chart. This two-way quality is precisely why experienced gold traders keep a dollar chart open beside their gold chart at all times, treating the two as a single combined picture rather than as separate markets, since neither can be fully understood in isolation from the other.
Building the relationship into a gold trading process
The complete intermediate approach weaves the dollar into the gold trading process at every step. When analyzing a potential gold trade using the technical techniques from the Foundation series, the trader first identifies the setup on the gold chart, support, resistance, trend, the usual tools. Then, before acting, they consult the dollar: is it confirming the gold setup by moving in the helpful direction, or contradicting it? They also consider the interest rate backdrop, since it drives both. A gold trade with the chart, the dollar, and the rate environment all aligned is a high-conviction setup deserving of normal position size; a gold trade where the dollar or rates work against the chart setup is a lower-conviction situation deserving of reduced size or patience. This integrated reading, the gold chart interpreted in the context of the dollar and rates, is what distinguishes a competent intermediate gold trader from someone applying technical analysis to a gold chart in isolation, blind to the powerful macro forces pushing it around.
Practical guidelines
Remember that gold is priced in dollars, which creates a strong inverse relationship: a stronger dollar tends to pressure gold, a weaker dollar tends to lift it.
Use the dollar, often via the US Dollar Index, as a confirming indicator for gold trades; favor gold setups where the dollar agrees and be cautious where it conflicts.
Recognize that the gold-dollar relationship can temporarily break down, especially during extreme global fear when both can rise together, so monitor whether it is currently holding rather than assuming it always does.
Watch interest rate expectations, since rising rates tend to strengthen the dollar and weigh on gold simultaneously, often driving both sides of the relationship at once.
Build the dollar and rate backdrop into your gold process, treating a gold setup confirmed by the dollar and rates as high-conviction and one contradicted by them as low-conviction.
The expert article in this track goes deeper still, into the inflation-adjusted real interest rates that are arguably gold's single most important long-term driver, the positioning data that reveals how large speculators are betting, and the seasonal patterns that some gold traders incorporate, completing the picture of what moves the metal beneath its price chart.
Key takeaways
Gold is priced in dollars worldwide, creating a strong inverse relationship: when the dollar strengthens, gold tends to fall, and when the dollar weakens, gold tends to rise.
The real GLD breakdown below its ~$412 support in June 2026 coincided with the dollar strengthening to yearly highs, a textbook example of the relationship driving a gold move.
The dollar, often tracked via the US Dollar Index, serves as a powerful confirming indicator for gold trades, with confluence raising conviction and conflict warranting caution.
The gold-dollar relationship can temporarily break down, especially when extreme fear lifts both safe havens at once, so it must be monitored as a living tendency rather than assumed.
Interest rates often drive both sides of the relationship, since rising rates tend to strengthen the dollar and weigh on non-yielding gold simultaneously.
Disclaimer
This article is for educational purposes only and does not constitute financial or investment advice. The GLD example used here is real historical data shown for illustration and is not a recommendation to buy or sell any security or commodity. The gold-dollar diagram is a schematic illustration. Always do your own research and consider consulting a licensed financial advisor before trading or investing.