
BEGINNER LEVEL
Crypto TA 101: Why Bitcoin Charts Behave Differently
If you have already worked through the Foundation articles in this series, you arrive at cryptocurrency with a real advantage: support and resistance, trends, moving averages, risk management, and trading psychology all apply to a Bitcoin chart exactly as they apply to a stock or an index. The candlesticks mean the same thing, the swing highs and swing lows are read the same way, and the discipline of defining an entry, a stop, and a target before you trade matters just as much. This article is not about throwing any of that away. It is about understanding the specific ways crypto markets differ in character, so you can apply the same skills with the right expectations rather than being blindsided by behavior that would be unusual in a stock but is entirely normal in crypto.
Throughout this article we use real, verifiable data from the iShares Bitcoin Trust, ticker IBIT, one of the largest spot Bitcoin exchange-traded funds, which holds actual Bitcoin and tracks its price closely. Using a regulated, exchange-listed ETF as the example gives us clean, auditable daily price data from public market records, while still reflecting the genuine behavior of Bitcoin itself. The data shown covers April to June 2026, a period that, as we will see, captured crypto's character vividly.
The single biggest difference: volatility
The most important thing to internalize about cryptocurrency is that it moves far more violently than almost any traditional asset. A 2 percent move in a major stock index in a single day is a notable session that might make financial headlines. In crypto, a 2 percent daily move barely registers as news; 5, 10, even 15 percent single-day moves happen with a regularity that would be almost unthinkable in a large stock index. This is not a flaw to be feared so much as a defining feature to be respected and planned for, and it changes how nearly every technique from the Foundation series should be applied in practice.
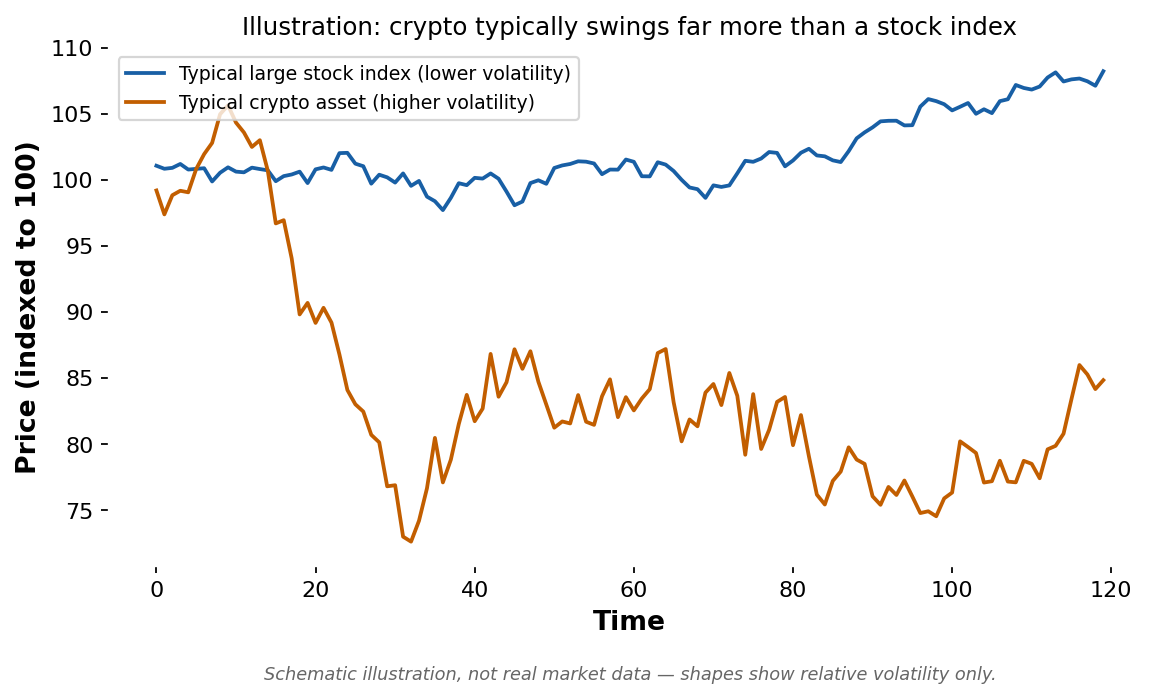
Schematic illustration, not real market data, showing the typical difference in volatility between a broad stock index and a crypto asset.
The schematic above illustrates the general relationship: over the same period, a crypto asset typically carves out far larger swings than a broad stock index, both upward and downward. This matters enormously for risk management. Recall from the Foundation series that position size is calculated from the distance between your entry and your stop. Because a sensible stop on a crypto position usually has to sit much further from the entry to avoid being triggered by ordinary noise, the same one-percent account risk translates into a much smaller position than it would on a calmer asset. A trader who ignores this and sizes a crypto position as if it were a stock is taking on dramatically more real risk than they realize.
A real example of crypto's character
Rather than describe crypto's volatility in the abstract, here is what it actually looked like in real, verifiable data over a recent two-and-a-half-month stretch.
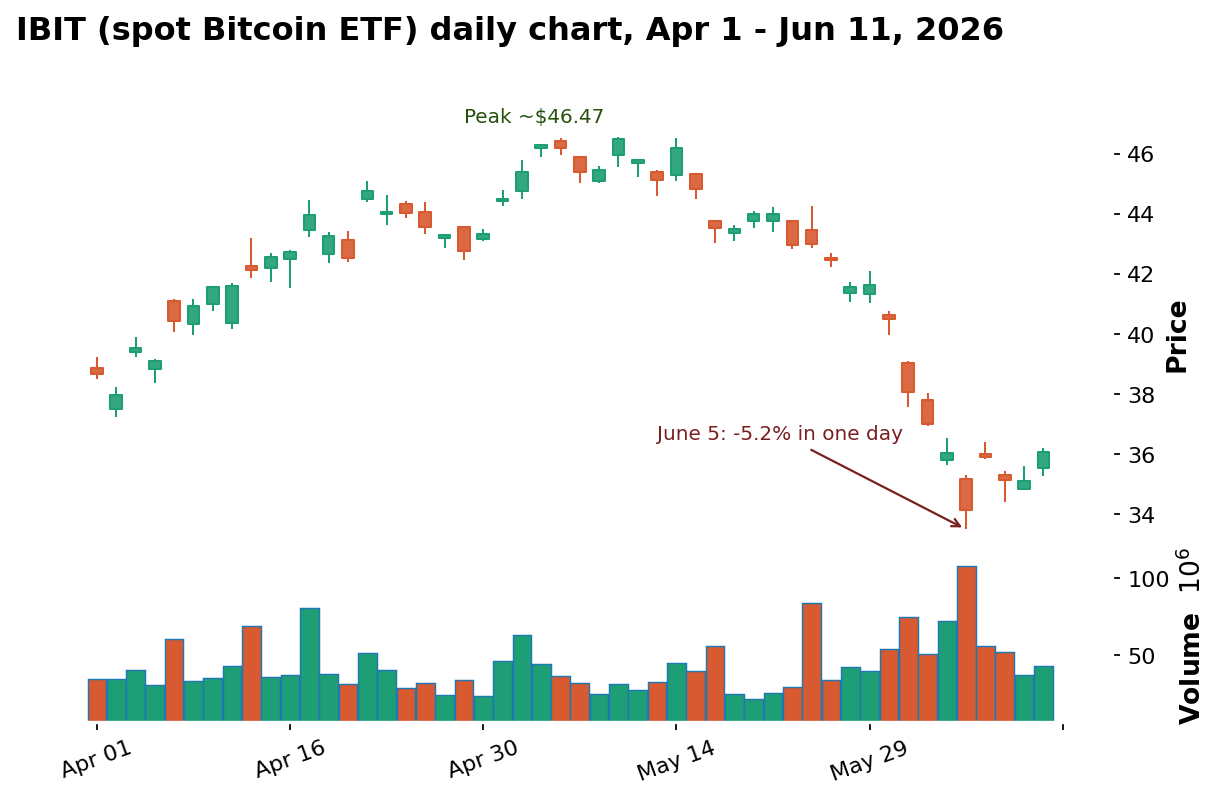
Data: stockanalysis.com (S&P Global), iShares Bitcoin Trust (IBIT), daily candles, Apr 1 – Jun 11, 2026.
This real chart tells a complete crypto story in miniature. Through April the price climbs steadily from around $38 to a peak near $46.47 in mid-May, an advance that would have felt, at the time, like a healthy uptrend of exactly the kind covered in the Foundation series. Then the character turns: the price rounds over and begins a decline that accelerates through late May and into June, culminating in a brutal single session on June 5 where the price fell more than 5 percent in one day, on the heaviest trading volume of the entire period, visible as the tall bar in the volume panel beneath the price. From the mid-May peak near $46.47 to the early-June low near $33.48, the price fell roughly 28 percent in under a month. That is a genuinely savage decline by the standards of a stock index, yet for crypto it is an ordinary, recurring kind of move, not a once-in-a-decade crash.
Notice that the technical tools still worked here. The uptrend was real while it lasted, the rounded top was a recognizable warning that momentum was fading, and the accelerating decline on rising volume was a textbook sign of selling pressure overwhelming buyers. Crypto did not break the rules of technical analysis; it simply ran the same playbook at a much higher amplitude and speed than a traditional asset would.
Crypto trades 24 hours a day, 7 days a week
A stock exchange opens and closes on a fixed schedule and is shut on weekends and holidays. The underlying cryptocurrency market never closes; Bitcoin trades continuously, every hour of every day, all year. This has several practical consequences worth understanding from the start. There is no opening or closing bell to anchor the trading day, which means the natural session-based rhythm that structures a stock chart simply does not exist for the underlying asset. Major price moves frequently happen overnight or over the weekend, when a trader is asleep or away, which makes hard, automatic stop-loss orders even more essential in crypto than in stocks, since you cannot rely on being awake to react. The ETF used in this article, IBIT, does trade only during regular US market hours, which is actually one practical reason some traders prefer the ETF wrapper, but the Bitcoin it holds keeps moving around the clock, so the ETF can open with a substantial gap reflecting overnight crypto moves.
Why crypto is more sentiment-driven
A traditional stock has a business underneath it with revenues, profits, and assets that provide at least some anchor for what it might reasonably be worth. Cryptocurrencies, by contrast, have no earnings and no cash flows in the traditional sense, which means their prices are driven almost entirely by supply, demand, and collective sentiment, the balance of fear and greed among participants. This makes the psychological factors covered in the Foundation series, FOMO, fear, herd behavior, even more dominant in crypto than in stocks. The sharp June decline in the real chart above was, according to contemporaneous financial news, driven substantially by shifting sentiment and large holders selling, rather than by any change in Bitcoin's underlying technology. When sentiment is the primary driver, moves can be faster, sharper, and less tethered to anything a fundamental analyst could have modeled in advance, which is precisely why technical analysis, the study of price behavior itself, is so widely used in this market.
The role of round numbers and key psychological levels
Because crypto is so sentiment-driven and so widely discussed in public, the psychological round numbers covered in the support and resistance article tend to matter even more here than in traditional markets. Big round figures for Bitcoin itself, such as $50,000 or $100,000, become the subject of intense, widespread public attention, which can turn them into significant support or resistance levels through sheer collective focus, a self-reinforcing feedback loop that is somewhat more pronounced in retail-heavy crypto than in institution-dominated markets. The same applies to prior all-time highs and the lows of major previous declines, which the entire market watches simultaneously.
The four-year cycle and crypto's boom-bust rhythm
One feature of crypto that genuinely has no clean equivalent in traditional markets is its tendency toward large, multi-year boom-and-bust cycles, historically discussed in connection with Bitcoin's halving, a programmed event roughly every four years that cuts the rate of new Bitcoin creation in half. Whether or not the halving causes the cycles, the empirical pattern over Bitcoin's history has been dramatic: long bull markets that carry the price to a new all-time high, followed by brutal bear markets that can erase 70 to 80 percent of the value before the next cycle begins. The real decline captured in this article's data, a sharp drop from the mid-May peak, is a small window into the kind of downside volatility that defines crypto's bear phases. For a technical analyst, the practical implication is humility about timeframe: a move that looks like a catastrophic collapse on a daily chart may be an ordinary correction within a larger cycle, or it may be the start of a genuine multi-month bear market, and distinguishing the two requires the multi-timeframe perspective from the Foundation series even more than in stocks. Zooming out to the weekly or monthly chart is not optional in crypto; it is the only way to keep a single violent week in its proper context.
Liquidity and why smaller coins are far riskier
Everything in this article so far has used Bitcoin, via the IBIT ETF, as the example, and that is deliberate, because Bitcoin is by far the most liquid and heavily traded cryptocurrency. The thousands of smaller cryptocurrencies, often called altcoins, are an entirely different and far more dangerous proposition for a beginner. Lower liquidity means that the same techniques become less reliable: support and resistance levels are less well-defined, price can gap violently on relatively small orders, and the spread between buying and selling prices can be punishingly wide. Smaller coins are also far more prone to manipulation and to losing essentially all their value, something that effectively never happens to a major stock index but is common in the long tail of crypto. The disciplined path for someone learning crypto technical analysis is to start with the most liquid, established assets, where the charts are cleanest and the techniques most reliable, before ever considering the thinly traded coins where the apparent opportunities come wrapped in dramatically higher risk.
Applying the Foundation skills to crypto, with adjusted expectations
Use wider stops than you would on a stock, placed beyond genuine support or resistance levels, and let the wider stop automatically reduce your position size so dollar risk stays constant.
Rely on hard, automatic stop-loss orders rather than mental stops, because major crypto moves frequently happen overnight or over the weekend when you cannot react manually.
Expect overbought and oversold readings to persist longer and reach further extremes than in stocks, since crypto trends can run harder in both directions before exhausting.
Treat psychological round numbers and prior highs and lows as especially significant levels, given how intensely the whole market watches them at once.
Take position sizing and the one-to-two-percent risk guideline even more seriously than in stocks, because crypto's larger swings make oversized positions dangerous far faster.
The overarching lesson of this article is reassuring rather than intimidating: you do not need a separate, secret body of knowledge to read a Bitcoin chart. The Foundation skills transfer directly. What changes is the amplitude and the speed, the volatility is higher, the moves are faster, the market never sleeps, and sentiment dominates, all of which means the risk management and psychological discipline you already learned matter more here, not less. The remaining two articles in this crypto track build on this foundation, looking specifically at how to trade crypto's volatility and how on-chain data adds a dimension that has no equivalent in traditional markets.
Key takeaways
Every core technical analysis skill from the Foundation series, support and resistance, trends, indicators, risk management, and psychology, applies directly to crypto charts.
Crypto's defining difference is far higher volatility: single-day moves of 5 to 15 percent are routine, where a 2 percent move would be notable in a stock index.
The real IBIT data from Apr to Jun 2026 shows this vividly, with a roughly 28 percent decline from the mid-May peak near $46.47 to the early-June low near $33.48, including a 5 percent single-day drop on record volume.
Crypto trades 24/7, so major moves often happen overnight or on weekends, making hard automatic stop-losses even more essential than in stocks.
Crypto is more sentiment-driven than stocks because it has no underlying earnings, which makes psychological discipline and careful, volatility-adjusted position sizing more important, not less.
Disclaimer
This article is for educational purposes only and does not constitute financial or investment advice. Cryptocurrency is a highly volatile and speculative asset class, and you should never invest more than you can afford to lose entirely. The IBIT example used here is real historical data shown for illustration and is not a recommendation to buy or sell any security or cryptocurrency. The volatility-comparison diagram is a schematic illustration, not real market data. Always do your own research and consider consulting a licensed financial advisor before trading or investing.