
EXPERT LEVEL
Backtesting Your Strategy: From Idea to Statistical Edge
Every technique covered in this series so far, support and resistance, trend identification, moving averages and RSI, chart patterns, has been presented with a real example showing it working. That is honest as far as it goes, but it is also exactly the kind of evidence that should make a careful trader suspicious, because hand-picked examples of a technique working prove very little on their own. Backtesting is the discipline of testing an idea systematically across real historical data, including the periods where it does not work, to find out whether it has a genuine statistical edge or simply looked good in the one example you happened to choose.
What a backtest actually is
A backtest takes a precisely defined, mechanical set of rules, an exact entry condition and an exact exit condition, and applies those rules systematically to historical price data, then measures the results as if the rules had genuinely been followed in real time. The key word is mechanical: a backtest cannot test a vague idea like "buy when the chart looks bullish," because that judgment cannot be applied identically to every single day of historical data. It can test a precise rule like "buy when the 10-day moving average crosses above the 20-day moving average, and sell when it crosses back below," because that rule produces an unambiguous, repeatable decision on every single day of available data.
A real backtest, calculated from real SPY data
Here is a genuine, fully calculated backtest, not a description of a hypothetical one. The rule is a classic moving average crossover: hold a long position whenever the 10-day simple moving average is above the 20-day simple moving average, and hold no position otherwise, applied to the real daily SPY closing prices used in this series, from April to June 2026. Trades are entered and exited on the day following each crossover signal, a standard convention that avoids the unrealistic assumption of trading at a price you could not have known yet.
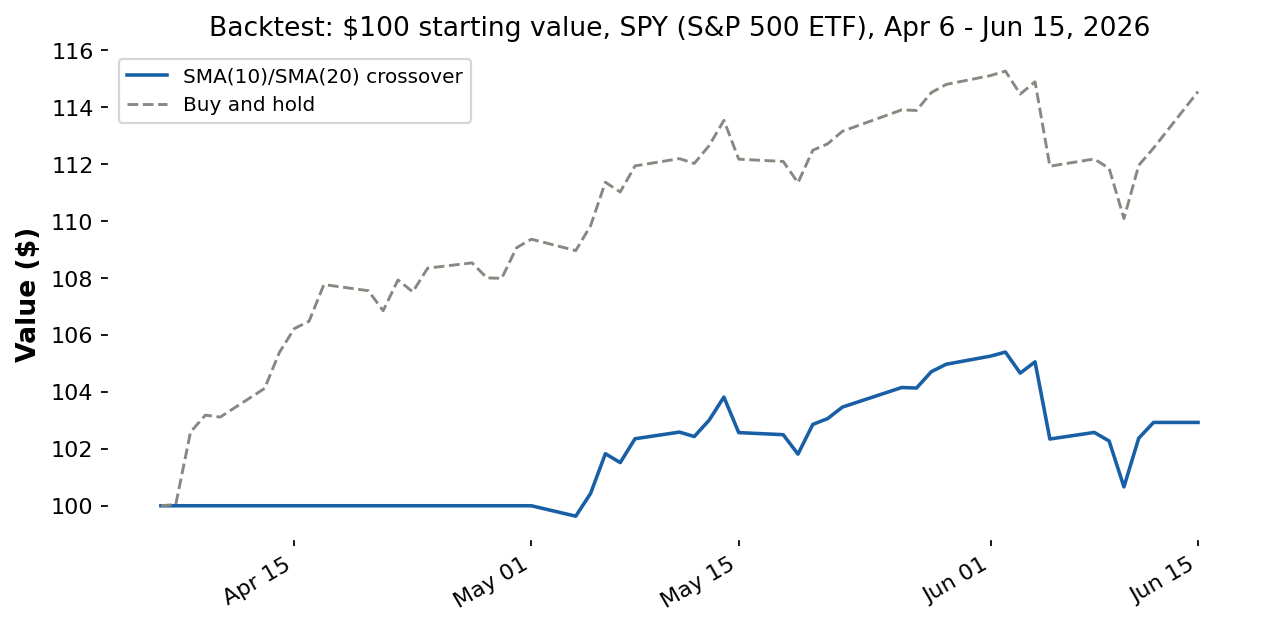
Calculated from real SPY daily closes, Apr 6 – Jun 15, 2026. Strategy: long when SMA(10) > SMA(20), flat otherwise, trades executed one day after each signal.
The results are genuinely instructive, and not flattering to the strategy. A starting value of $100 invested using this exact crossover rule grew to about $102.93 by the end of the period. Simply buying SPY on April 6 and holding it, with no trading at all, grew the same $100 to about $114.55. The mechanical crossover strategy substantially underperformed a simple buy-and-hold approach over this specific real window, even though both ended profitable. This is a real, calculated result, not a cherry-picked failure invented to make a point, and it illustrates something important: moving average crossover strategies are inherently laggy, since they only signal a change after the shorter average has already crossed the longer one, which means they systematically miss the early portion of strong, sustained moves like the powerful April and May rally that dominated this window. The strategy sat in cash through the entire early part of the climb, waiting for the crossover to confirm, and never caught up. A strategy built specifically for choppy, range-bound conditions, or one using faster-reacting inputs, might have performed quite differently.
Why one short backtest is not enough
This single, roughly two-and-a-half-month backtest should not be read as proof that moving average crossovers are bad, any more than the earlier articles should be read as proof that support and resistance, RSI, or chart patterns are infallible. A sample of one asset over one short period, containing essentially one strong, sustained uptrend, is nowhere near enough data to draw a reliable conclusion about a strategy's genuine edge. A trustworthy backtest typically needs a meaningfully longer history, ideally spanning multiple different market conditions, trending, range-bound, and volatile, and ideally tested across more than a single asset, before its results say much about how the strategy is likely to behave going forward.
Overfitting: the trap that makes backtests lie
Overfitting occurs when a strategy's exact rules are tuned, often unconsciously, specifically to maximize performance on the historical data being tested, producing spectacular backtested results that have no real predictive power going forward because the rules were essentially reverse-engineered to fit noise specific to that one historical sample. A reliable warning sign is a strategy with an unusually large number of adjustable parameters, multiple specific moving average lengths, multiple specific RSI thresholds, all tuned simultaneously until the backtest looks excellent. The standard defense is to test a strategy on one stretch of historical data, called the in-sample period, finalize the rules there, and then test those exact same unchanged rules on a separate, later stretch the rules were never tuned against, called out-of-sample data, before trusting the result.
Walk-forward testing: a more rigorous alternative
A more rigorous variation on the simple in-sample and out-of-sample split is walk-forward testing, which better simulates how a strategy would actually have been used in real time. Rather than tuning once on an early block and testing once on a later block, walk-forward testing repeats the process in a rolling sequence: tune the strategy on an initial window, test it on the next short period, then roll the entire window forward in time, re-tuning on a new block that now includes the just-tested period, and testing again on the next period, repeating this cycle through the available history. This produces a much larger, more realistic sample of genuinely out-of-sample results stitched together, and a strategy that performs reasonably consistently across many successive walk-forward windows is considerably more trustworthy than one tested with a single one-time split.
Survivorship bias and lookahead bias
Two additional, easy-to-miss errors can inflate backtested results even when overfitting and trading costs have been handled. Survivorship bias occurs when a backtest is run only on assets that still exist and trade today, silently excluding companies that went bankrupt or were delisted, which removes many of history's worst outcomes and makes a strategy look safer than it actually was. Lookahead bias occurs when a backtest accidentally uses information that would not have been available on the date being simulated, for example calculating a signal using a day's closing price and then assuming a trade could have been entered at that same day's opening price, when the open occurs before the close and the signal would not yet have existed. The SPY backtest here specifically guards against this simpler version by entering and exiting on the day following each crossover signal rather than the same day, a standard and important convention any credible backtest must follow.
Realistic costs a backtest needs to include
A backtest that ignores trading costs is measuring a strategy that does not exist in the real world. Commissions, even where a broker advertises commission-free trading, are typically offset through the bid-ask spread, the small gap between the price you can buy at and the price you can sell at, which quietly erodes returns on every trade, especially for strategies that trade frequently. Slippage, the difference between the price a backtest assumes you traded at and the price you could realistically have gotten in live conditions, particularly during fast-moving or low-liquidity moments like the June 5 plunge in this series' data, also needs accounting for, usually by deliberately assuming a slightly worse fill than the theoretical best price on every trade.
What a clean backtest still cannot tell you
Even a long, carefully constructed, walk-forward tested backtest with realistic costs answers a narrower question than it might seem to. It tells you how a specific, mechanical rule set would have performed across the specific historical periods you tested. It cannot guarantee that future conditions will resemble the periods tested closely enough for those results to repeat, and it says nothing about a trader's actual ability to follow the mechanical rules with real money on the line, which is precisely why the earlier articles on risk management and trading psychology matter just as much as the backtest itself. A strategy with excellent backtested statistics, traded by someone who cannot resist deviating from the rules during a real losing streak or a sharp plunge, will not produce the backtested results in practice, no matter how rigorous the original testing was.
Key metrics to evaluate beyond the final return
The ending account value is the most obvious output of a backtest, but it is far from the most informative, and judging a strategy by total return alone is a classic beginner mistake. Several other metrics matter at least as much. The maximum drawdown, the largest peak-to-trough decline the strategy experienced along the way, tells you whether you could have psychologically and financially survived the worst stretch, since a strategy that ends up forty percent but suffered a sixty percent drawdown en route is unusable for most real traders. The win rate and average win-to-loss ratio, the same numbers underlying the expectancy calculation from the position sizing article, reveal how the returns were actually generated, whether by many small wins or a few large ones, which has real implications for how the strategy will feel to trade. The number of trades matters too, since a strategy that produced its results across only a handful of trades has told you very little of statistical significance, regardless of how good the final number looks. A thoughtful evaluation weighs all of these together rather than fixating on the single headline figure of total return.
From backtest to live trading
A strategy that survives a long, multi-condition, out-of-sample backtest with realistic costs has earned the right to a small amount of real capital, not a full allocation immediately. The standard, careful progression moves from backtesting to a period of paper trading the exact same rules in real time, then to live trading with a small position size, increasing exposure gradually only as real-time results continue to track reasonably close to what the backtest predicted. A strategy that performs dramatically worse in real-time paper trading than its backtest suggested is a strong signal that something, often overfitting or unrealistic cost assumptions, was wrong with the original test.
Practical guidelines
Define every rule mechanically and unambiguously before backtesting; if you cannot apply the rule identically to every historical day without judgment calls, it cannot be properly backtested.
Test across multiple market conditions and, where possible, multiple assets, not a single short window containing only one type of price behavior, as this SPY example deliberately demonstrates.
Reserve a portion of historical data as out-of-sample, never used while building or tuning the strategy, and treat its results as far more meaningful than the in-sample results.
Build realistic trading costs, including the bid-ask spread and reasonable slippage assumptions, into every backtest rather than assuming perfect, frictionless fills.
Move from backtest to paper trading to small live size gradually, and treat a significant gap between backtested and real-time performance as a serious warning sign worth investigating before increasing size.
Treat backtesting as a continuous, ongoing discipline rather than a one-time gate a strategy passes through before going live. Markets evolve, and a strategy that tested well across one multi-year stretch can gradually stop working as conditions change, which is exactly why periodically re-testing and re-validating any strategy you trade, including the simple crossover example used here, remains good practice for as long as you continue using it.
Key takeaways
A backtest applies a precisely defined, mechanical rule systematically across historical data to measure whether an idea has a genuine statistical edge, rather than relying on a single illustrative example.
A real, calculated SMA(10)/SMA(20) crossover backtest on SPY from Apr to Jun 2026 grew $100 to about $102.93, substantially underperforming a simple buy-and-hold result of about $114.55, illustrating the inherent lag of crossover strategies during strong trends.
A single short backtest on one asset is not sufficient evidence; reliable conclusions require testing across multiple market conditions and ideally multiple assets.
Overfitting happens when rules are tuned to fit historical noise rather than a genuine edge; out-of-sample and walk-forward testing are the standard defenses.
Realistic costs must be included, and live trading should be approached gradually, starting small, with any major gap from backtested results treated as a warning sign.
Disclaimer
This article is for educational purposes only and does not constitute financial or investment advice. The backtest shown here uses a simplified strategy on a single, short, real historical SPY window and is intended to illustrate backtesting methodology, not to recommend any trading strategy or security. Past performance, simulated or real, does not guarantee future results. Always do your own research and consider consulting a licensed financial advisor before trading or investing.